A
B
C
D
Text Solution
Verified by Experts
The correct Answer is:


Topper's Solved these Questions
Similar Questions
Explore conceptually related problems
AAKASH SERIES-WORK, POWER & ENERGY -EXERCISE - II (ENERGY)
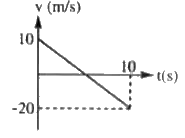
- Velocity - time graph of a particle moving in a straight line is as sh...
Text Solution
|
- A particle of mass 0.1 kg is subjected to a force which varies with d...
Text Solution
|
- A uniform metre scale of mass 2kg is suspended from on end. If it is d...
Text Solution
|
- Two sopheres whose radii are in the ratio 1:2 are moving with theier v...
Text Solution
|
- A river of salty water is flowing with a velocity 2 ms^(-1) If the d...
Text Solution
|
- When a spring is compresssed by 3 cm the potential energy stored in it...
Text Solution
|
- If the kinetic energy of a body increases by 125% the percentage incre...
Text Solution
|
- The kinetic energy of a body is s.K.. If one - fourth of its mass is r...
Text Solution
|
- A body of mass 6 kg is under a force which causes displacement in it g...
Text Solution
|
- A particle of mass 100 g is thrown verticaly upwards with the speed of...
Text Solution
|
- A bullet of mass 10 gm hits a fixed target and penetrates through 8 cm...
Text Solution
|
- A body of mass 5 kg has linear momentum of 20 kgm/s. If a constant for...
Text Solution
|
- The ratio of energy required to accelerated a car from rest to 20ms^(-...
Text Solution
|
- A light string of length 20 cm is carrying a bob of mas 100 gm. If is ...
Text Solution
|
- A particle is projected at 60^(@) to the horizontal with a kinetic ene...
Text Solution
|
- A ball released from a height of 20m, hits the ground and rebounds to...
Text Solution
|
- A car moving with a velocity of 72 KMPH stops engine just before ascen...
Text Solution
|
- A simple pendilum is swinging in a vertical plane. The ratio of its po...
Text Solution
|
- A 2kg block is dropped from a height of 0.4 m on a spring of force con...
Text Solution
|
- A body is swinging on a swing such that his lowest and highest positio...
Text Solution
|