Home
Class 11
PHYSICS
Which of the diagram shown in figure re...

Which of the diagram shown in figure represents variation of total mechanical energy of a pendulum oscillating in air as function of time?

A

B

C

D

Text Solution

Verified by Experts

The correct Answer is:
C

When a pendulum oscillates in air ,it will lose energy continuously due to air resistance . Thus , mechanical energy of the pendulum decreases continuously with time .
The fluctuation is represented by curve
Promotional Banner

Topper's Solved these Questions

  • WORK, ENERGY AND POWER

    KUMAR PRAKASHAN|Exercise SECTION - D NCERT Exemplar Solutions (Very Short Answer Type Questions)|12 Videos
  • WORK, ENERGY AND POWER

    KUMAR PRAKASHAN|Exercise SECTION - D NCERT Exemplar Solutions (Short Answer Type Questions)|10 Videos
  • WORK, ENERGY AND POWER

    KUMAR PRAKASHAN|Exercise SECTION - C Objective Questions (VSQs)|52 Videos
  • WAVES

    KUMAR PRAKASHAN|Exercise SECTION-F (Questions From Module) (Sample questions for preparation of competitive exams)|23 Videos

Similar Questions

Explore conceptually related problems

Which of the diagram shown in figure most closely shows the variation in kinetic energy of the earth as it moves once around the sun in its elliptical orbit ?

A raindrop falling from a height h above ground , attains a near terminal velocity when it has fallen through a height (3/4) h . Which f the diagrams shown in figure correctly shows the change in kinetic and potential energy of the drop during its fall up to the ground ?

Which of the diagrams in figure correctly shows the change in kinetic energy of an iron sphere falling freely in a lake having sufficient depth to impart it a terminal velocity ?

Two stones are thrown up simultaneously from the edge of a cliff 200 m high with initial speeds of 15 ms^(- ) and 30 ms^(-1). Verify that the graph shown in figure. Correctly represents the time variation of the relative position of the second stone with respect to the first. Neglect air resistance and assume that the stones do not rebound after hitting the ground. Take g = 10 ms^(-2). Give the equations for the linear and curved parts of the plot.

A graph shown in the figure represents the variation of uniform magnetic field with time. If this field linked with a conducting loop completely and its perpendicular to the plane of the coil. In which time interval of induced emf in the coil is maximum ?

Which among the curves shown in figure cannot possibly represent electrostatic field lines ?

The potential energy U(x) of a particle moving along x- axis is shown in figure. Which one of the following graphs represents the variation of kinetic energy of this particle if its total mechanical enery is E_(0)

For a particle executing (SHM) the displacement (x) is given by (x = A) cos (omega) t . Identify the graph which represents the variation of potential energy (PE) as a function of time (t) and displacement (x). (##JMA_CHMO_C10_006_Q01##), (##JMA_CHMO_C10_006_Q02##).

Draw a graph to show the variation of PE, KE and total energy of a simple harmonic oscillator with displacement.

Which vector in the figures best represents the acceleration of a pendulum mass intemediate point in its saving??

KUMAR PRAKASHAN-WORK, ENERGY AND POWER -SECTION - D NCERT Exemplar Solutions (Multiple Choice Questions)
  1. A proton is kept at rest . A positively charged particle is released f...

    Text Solution

    |

  2. A man squating on the ground gets straight up and stand . The force of...

    Text Solution

    |

  3. A cyclist comes to a skidding stop in 10 m . During this process , the...

    Text Solution

    |

  4. A body is falling freely under the action of gravity alone in vacumm ....

    Text Solution

    |

  5. During inelastic collision between two bodies , which of the following...

    Text Solution

    |

  6. Two inclined frictionless tracks , one gradual and the other steep mee...

    Text Solution

    |

  7. The potential energy function for a particle executing linear SHM is g...

    Text Solution

    |

  8. Two identical ball bearing in contact each other and resting on a fric...

    Text Solution

    |

  9. A body of mass 0.5 kg travels in a straight line with velocity v = ax^...

    Text Solution

    |

  10. A body is moving unidirectionally under the influence of a source of c...

    Text Solution

    |

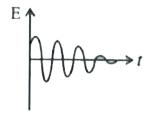
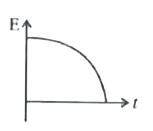
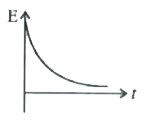
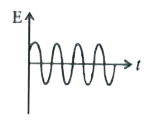
  11. Which of the diagram shown in figure most closely shows the variation ...

    Text Solution

    |

  12. Which of the diagram shown in figure represents variation of total me...

    Text Solution

    |

  13. A mass of 5 kg is moving along a circular path of radius 1 m . If the ...

    Text Solution

    |

  14. A raindrop falling from a height h above ground , attains a near term...

    Text Solution

    |

  15. In a shot put event an athlete throws the shot put of mass 10 kg with ...

    Text Solution

    |

  16. Which of the diagrams in figure correctly shows the change in kinetic...

    Text Solution

    |

  17. A cricket ball of mass 150 g moving with a speed of 126 km/h hits ...

    Text Solution

    |

  18. A man of mass m , standing at the bottom of the staircase of height L ...

    Text Solution

    |

  19. A bullet of mass m fired at 30^(@) to the horizontal leaves the barre...

    Text Solution

    |

  20. Two blocks M(1) and M(2) having equal mass are free to move on a horiz...

    Text Solution

    |