A
B
C
D
Text Solution
AI Generated Solution
The correct Answer is:


Topper's Solved these Questions
MOTION IN A STRAIGHT LINE
NCERT FINGERTIPS ENGLISH|Exercise INSTANTANEOUS VELOCITY AND SPEED|16 VideosMOTION IN A STRAIGHT LINE
NCERT FINGERTIPS ENGLISH|Exercise ACCELERATION|19 VideosMOTION IN A STRAIGHT LINE
NCERT FINGERTIPS ENGLISH|Exercise POSITION, PATH LENGTH AND DISPLACEMENT|6 VideosMOTION IN A PLANE
NCERT FINGERTIPS ENGLISH|Exercise Assertion And Reason|15 VideosOSCILLATIONS
NCERT FINGERTIPS ENGLISH|Exercise Assertion And Reason|15 Videos
Similar Questions
Explore conceptually related problems
NCERT FINGERTIPS ENGLISH-MOTION IN A STRAIGHT LINE-AVERAGE VELOCITY AND AVERAGE SPEED
- Which of the following statements is incorrect? (i) Average velocity i...
Text Solution
|
- A car is moving along a straight (OP). It moves from O to P in 18 seco...
Text Solution
|
- The area under velocity-time graph for a particle in a given interval ...
Text Solution
|
- A cyclist moving a car circular track of raidus 40 cm completes half a...
Text Solution
|
- The position of an object moving along x-axis is given by x=a +bt^(2),...
Text Solution
|
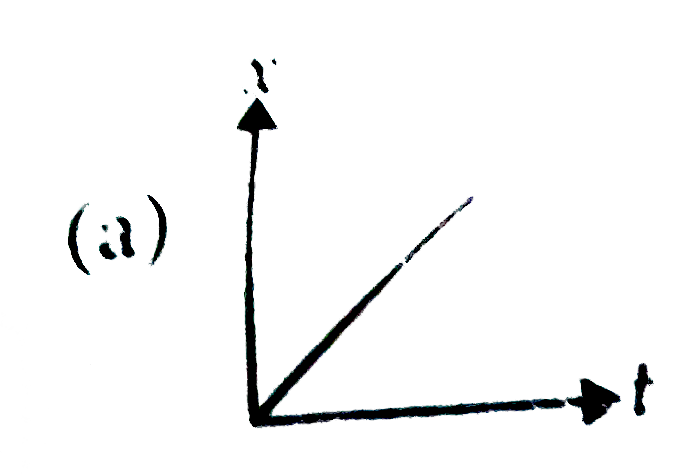
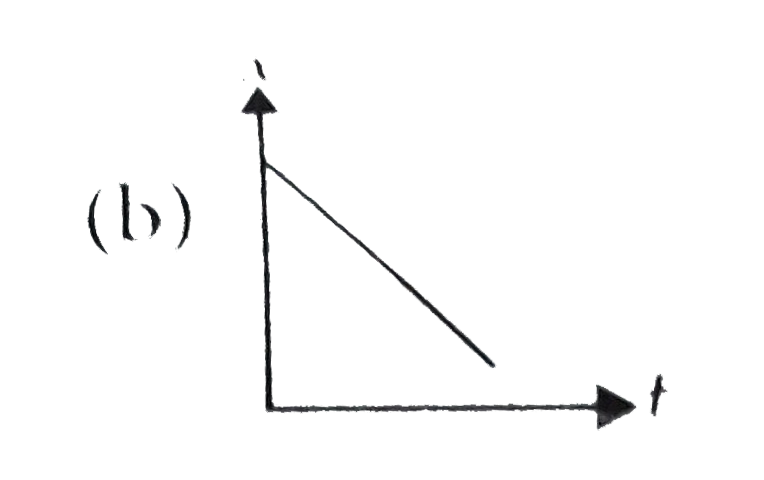
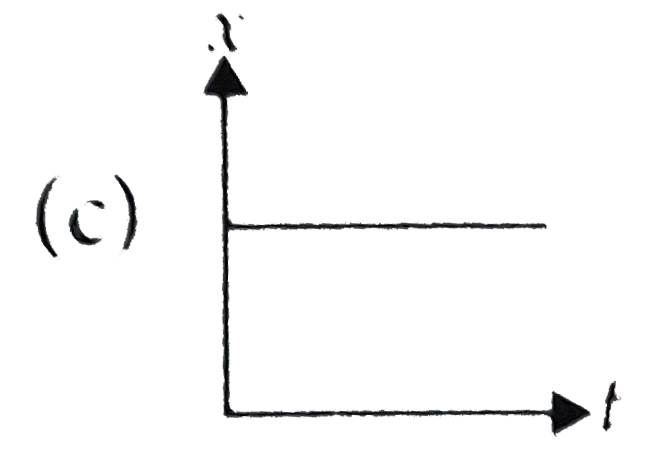
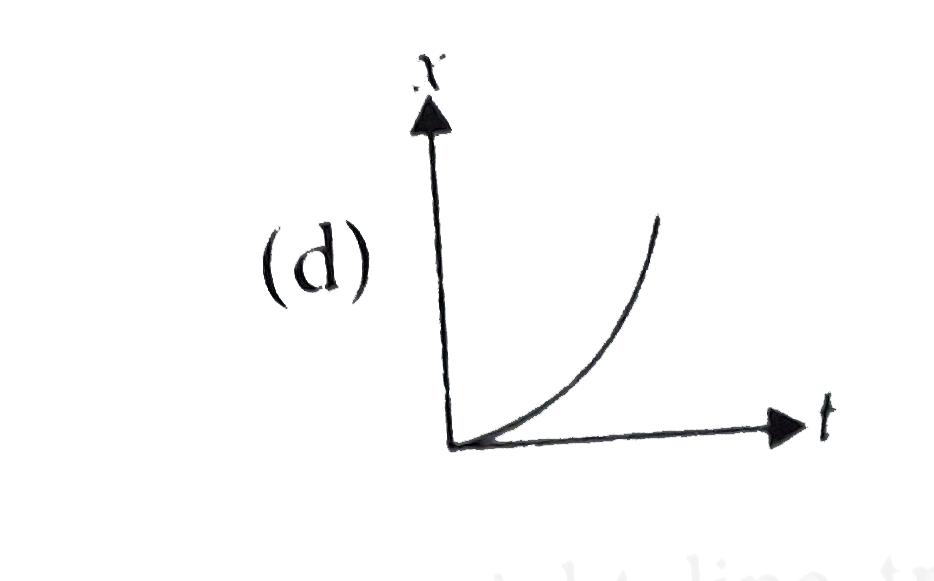
- Which of the following graphs represents the position time-graph of a ...
Text Solution
|
- A body moving along a straight line travels one third of the total dis...
Text Solution
|
- A man walks on a straight road from his home to a market 2.5 km away ...
Text Solution
|