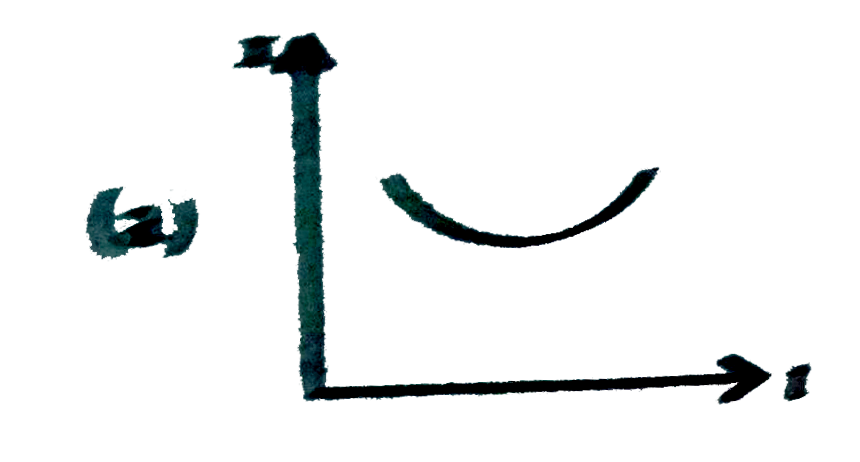
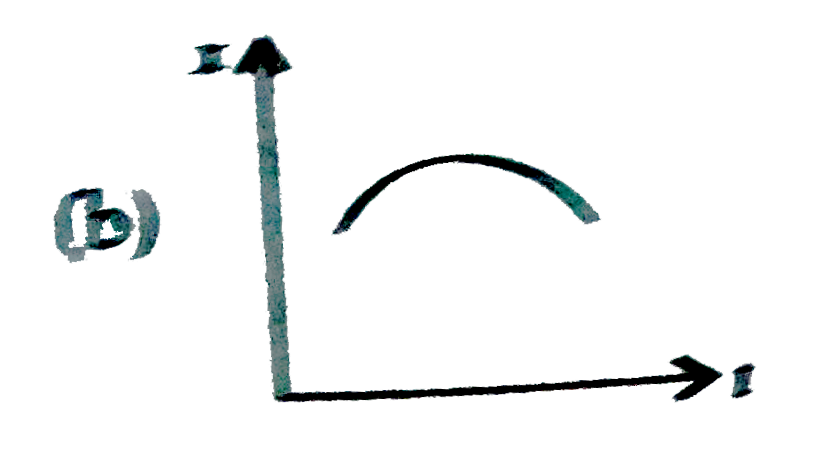
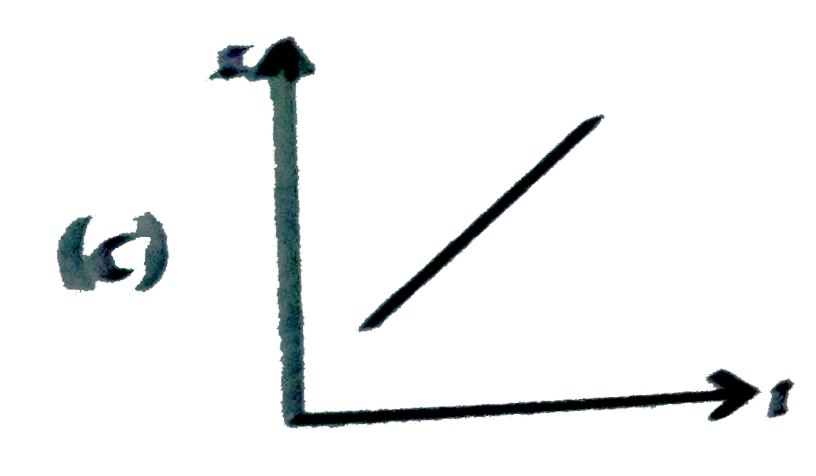
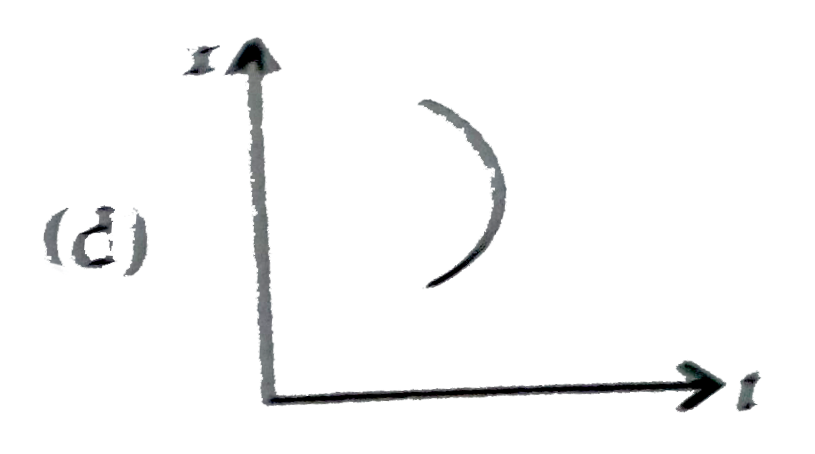
Home
Class 11
PHYSICS
Position-time graph for motion with zero...

Position-time graph for motion with zero acceleration is

A

B

C

D

Text Solution

AI Generated Solution

The correct Answer is:
To determine the position-time graph for motion with zero acceleration, we can follow these steps: ### Step-by-Step Solution: 1. **Understand the Concept of Zero Acceleration**: - When acceleration is zero, it implies that the velocity of the object is constant. This means that the object is moving at a steady speed without speeding up or slowing down. 2. **Define Constant Velocity**: - Let’s denote the constant velocity as \( v = k \), where \( k \) is a constant value. 3. **Relate Velocity to Position and Time**: - The relationship between velocity, position, and time can be expressed as: \[ v = \frac{dx}{dt} \] - Since \( v \) is constant, we can substitute \( k \) into the equation: \[ \frac{dx}{dt} = k \] 4. **Integrate to Find Position**: - To find the position \( x \) as a function of time \( t \), we can rearrange and integrate: \[ dx = k \, dt \] - Integrating both sides gives: \[ \int dx = \int k \, dt \] - This results in: \[ x = kt + C \] - Here, \( C \) is the constant of integration, which represents the initial position of the object at \( t = 0 \). 5. **Interpret the Equation**: - The equation \( x = kt + C \) describes a straight line when plotted on a position-time graph. The slope of the line is equal to the constant velocity \( k \), and the y-intercept is the initial position \( C \). 6. **Draw the Position-Time Graph**: - Since the equation represents a linear relationship, the position-time graph will be a straight line. If \( k > 0 \), the line will slope upwards, indicating motion in the positive direction. If \( k < 0 \), the line will slope downwards, indicating motion in the negative direction. ### Conclusion: - The position-time graph for motion with zero acceleration is a straight line, which can be represented by the equation \( x = kt + C \).

To determine the position-time graph for motion with zero acceleration, we can follow these steps: ### Step-by-Step Solution: 1. **Understand the Concept of Zero Acceleration**: - When acceleration is zero, it implies that the velocity of the object is constant. This means that the object is moving at a steady speed without speeding up or slowing down. 2. **Define Constant Velocity**: ...
Promotional Banner

Topper's Solved these Questions

  • MOTION IN A STRAIGHT LINE

    NCERT FINGERTIPS ENGLISH|Exercise KINEMATIC EQUATIONS FOR UNIFORMLY ACCELERATED MOTION|32 Videos
  • MOTION IN A STRAIGHT LINE

    NCERT FINGERTIPS ENGLISH|Exercise RELATIVE VELOCITY|18 Videos
  • MOTION IN A STRAIGHT LINE

    NCERT FINGERTIPS ENGLISH|Exercise INSTANTANEOUS VELOCITY AND SPEED|16 Videos
  • MOTION IN A PLANE

    NCERT FINGERTIPS ENGLISH|Exercise Assertion And Reason|15 Videos
  • OSCILLATIONS

    NCERT FINGERTIPS ENGLISH|Exercise Assertion And Reason|15 Videos

Similar Questions

Explore conceptually related problems

Position - time graph for motion with negative acceleration is

STATEMENT - 1 : The slope on a position-time graph is representative of the acceleration of the object. STATEMENT - 2 : A straight, diagonal line on a position-time graph is representative of an onject with a constant velocity. STATEMENT - 3 : I an object is at rest, then the position-time graph must be a horizontal line located on the time-axis.

Draw the position-time graph of a moving object, moving with zero acceleration.

Graphs are very useful to represent a physical situation. Various quantities can be easily represented on graphs and other quantites can be determined from the graph. For example the slope of velocity-time graph represents instantaneous acceleration. For a motion with constant acceleration slope of velocity-time graph is constant. If acceleration is changing with time, slope with change and thus velocity-time graph will be a non-linear curve. Further the area of velocity-time graph gives displacement. For the above situation let t_(1) be the time of accelerated motion and t_(2) be the time or retarded motion, then the correct relation is

Graphs are very useful to represent a physical situation. Various quantities can be easily represented on graphs and other quantites can be determined from the graph. For example the slope of velocity-time graph represents instantaneous acceleration. For a motion with constant acceleration slope of velocity-time graph is constant. If acceleration is changing with time, slope will change and thus velocity-time graph will be a non-linear curve. Further the area of velocity-time graph gives displacement. For the given velocity-time graph the possibly correct acceleration-time relationship is

Graphs are very useful to represent a physical situation. Various quantities can be easily represented on graphs and other quantites can be determined from the graph. For example the slope of velocity-time graph represents instantaneous acceleration. For a motion with constant acceleration slope of velocity-time graph is constant. If acceleration is changing with time, slope with change and thus velocity-time graph will be a non-linear curve. Further the area of velocity-time graph gives displacement. The velocity-time graph for two objects P and Q are shown. The ratio of their respective acceleration is

Graphs are very useful to represent a physical situation. Various quantities can be easily represented on graphs and other quantites can be determined from the graph. For example the slope of velocity-time graph represents instantaneous acceleration. For a motion with constant acceleration slope of velocity-time graph is constant. If acceleration is changing with time, slope will change and thus velocity-time graph will be a non-linear curve. Further the area of velocity-time graph gives displacement. The correct relation between v_(0),a_(1),a_(2) and t_(0) is

Graphs are very useful to represent a physical situation. Various quantities can be easily represented on graphs and other quantites can be determined from the graph. For example the slope of velocity-time graph represents instantaneous acceleration. For a motion with constant acceleration slope of velocity-time graph is constant. If acceleration is changing with time, slope with change and thus velocity-time graph will be a non-linear curve. Further the area of velocity-time graph gives displacement. The average velocity of the car for the entire trip is

Graphs are very useful to represent a physical situation. Various quantities can be easily represented on graphs and other quantites can be determined from the graph. For example the slope of velocity-time graph represents instantaneous acceleration. For a motion with constant acceleration slope of velocity-time graph is constant. If acceleration is changing with time, slope will change and thus velocity-time graph will be a non-linear curve. Further the area of velocity-time graph gives displacement. For the given velocity-time graph the displacement of the object between t = 2 s to t = 4 s is

The velocity-time graph is given below Draw the acceleration-time graph and position-time graph, given that at t = 0, particle is at origin.

NCERT FINGERTIPS ENGLISH-MOTION IN A STRAIGHT LINE-ACCELERATION
  1. The displacement of a body is proporticonal to the cube of time elapse...

    Text Solution

    |

  2. Match Column I with Column II.

    Text Solution

    |

  3. The slope of the tangent at a point on the curve of concentration of a...

    Text Solution

    |

  4. The area under acceleration-time graph gives

    Text Solution

    |

  5. Which of the following statements is not correct regarding the motion ...

    Text Solution

    |

  6. Match the Column I with Column II.

    Text Solution

    |

  7. A particle moving along a straight line has a velocity v m s^(-1), whe...

    Text Solution

    |

  8. A particle moves rectilinearly. Its displacement x at time t is given ...

    Text Solution

    |

  9. A car starts from rest, attain a velocity of 36 km h^(-1) with an acce...

    Text Solution

    |

  10. A point moves with a uniform acceleration and v1 ,v2, v3 denote the a...

    Text Solution

    |

  11. A particle starts from point A moves along a straight line path with a...

    Text Solution

    |

  12. For the one dimensional motion, described by x=t-sint

    Text Solution

    |

  13. Position-time graph for motion with zero acceleration is

    Text Solution

    |

  14. The velocity -displacement graph of a particle is as shown in the figu...

    Text Solution

    |

  15. The velocity-time graph of a particle in one-dimensional motion is sho...

    Text Solution

    |

  16. Given below are four curves describing variation of velocity with time...

    Text Solution

    |

  17. The speed-time graph of a particle moving along a fixed direction is s...

    Text Solution

    |

  18. The given acceleration-time graph represents which of the following ph...

    Text Solution

    |

  19. The figure shows a particle moving along x - axis subjected to three p...

    Text Solution

    |