


Topper's Solved these Questions
Similar Questions
Explore conceptually related problems
CHETANA PUBLICATION-Statistics-EXERCISE
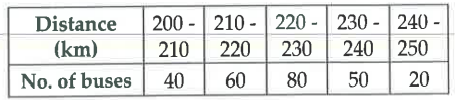
- The distance covered by 250 public transport buses in a day is shown i...
Text Solution
|
- Find the median of the data 54,63,66,72,98,87,92.
Text Solution
|
- Write the upper class limit and the lower class limit of the class 25-...
Text Solution
|
- The mean of eight numbers is 35.If a number is excluded then the mean ...
Text Solution
|
- The persons of O-blood group are 40%. The classification of persons ba...
Text Solution
|
- Different expenditures incurred on the construction of a building were...
Text Solution
|
- Cumulative frequencies in a grouped frequency table are useful to find...
Text Solution
|
- The formula to find mean from a grouped frequency table is bar x=A+g((...
Text Solution
|
- The formula to find mean by direct method is ..........
Text Solution
|
- Class width of any class interval is.....a) Lower limit + upper limit ...
Text Solution
|
- The formula for median is.... a) L+(N/2-c.f.)h/fb)L/2+(N/2-c.f.)h/f c)...
Text Solution
|
- The formula to find the mean deviation(bar d) in Assumed mean method i...
Text Solution
|
- In step deviation method, ui is given by...a)A+bar d b)(xi-A)/g c)(xi+...
Text Solution
|
- If sum fi di =1885 and sum fi=100, then the value of bar d is...a)1.88...
Text Solution
|
- The formula of mode is....a)L+[(f1-f0)/(2f1-f0-f2)] xxh b)L-[(f1-f0)/(...
Text Solution
|
- The formula to find mean by step deviation method is....a)(sum fiui)/(...
Text Solution
|
- A pie diagram represents the number of valid votes obtained by four st...
Text Solution
|
- A pie diagram represents the number of valid votes obtained by four st...
Text Solution
|
- A pie diagram represents the number of valid votes obtained by four st...
Text Solution
|
- A pie chart gives the marks scored in an examination by a student in v...
Text Solution
|
- A pie chart gives the marks scored in an examination by a student in v...
Text Solution
|