A
B
C
D
Text Solution
Verified by Experts
The correct Answer is:


Topper's Solved these Questions
ELASTICITY
DC PANDEY ENGLISH|Exercise Level 2 Comprehension Based|6 VideosELASTICITY
DC PANDEY ENGLISH|Exercise Level 2 Subjective|10 VideosELASTICITY
DC PANDEY ENGLISH|Exercise Level 2 Single Correct|10 VideosCURRENT ELECTRICITY
DC PANDEY ENGLISH|Exercise All Questions|469 VideosELECTROSTATICS
DC PANDEY ENGLISH|Exercise Integer|17 Videos
DC PANDEY ENGLISH-ELASTICITY-Level 2 More Than One Correct
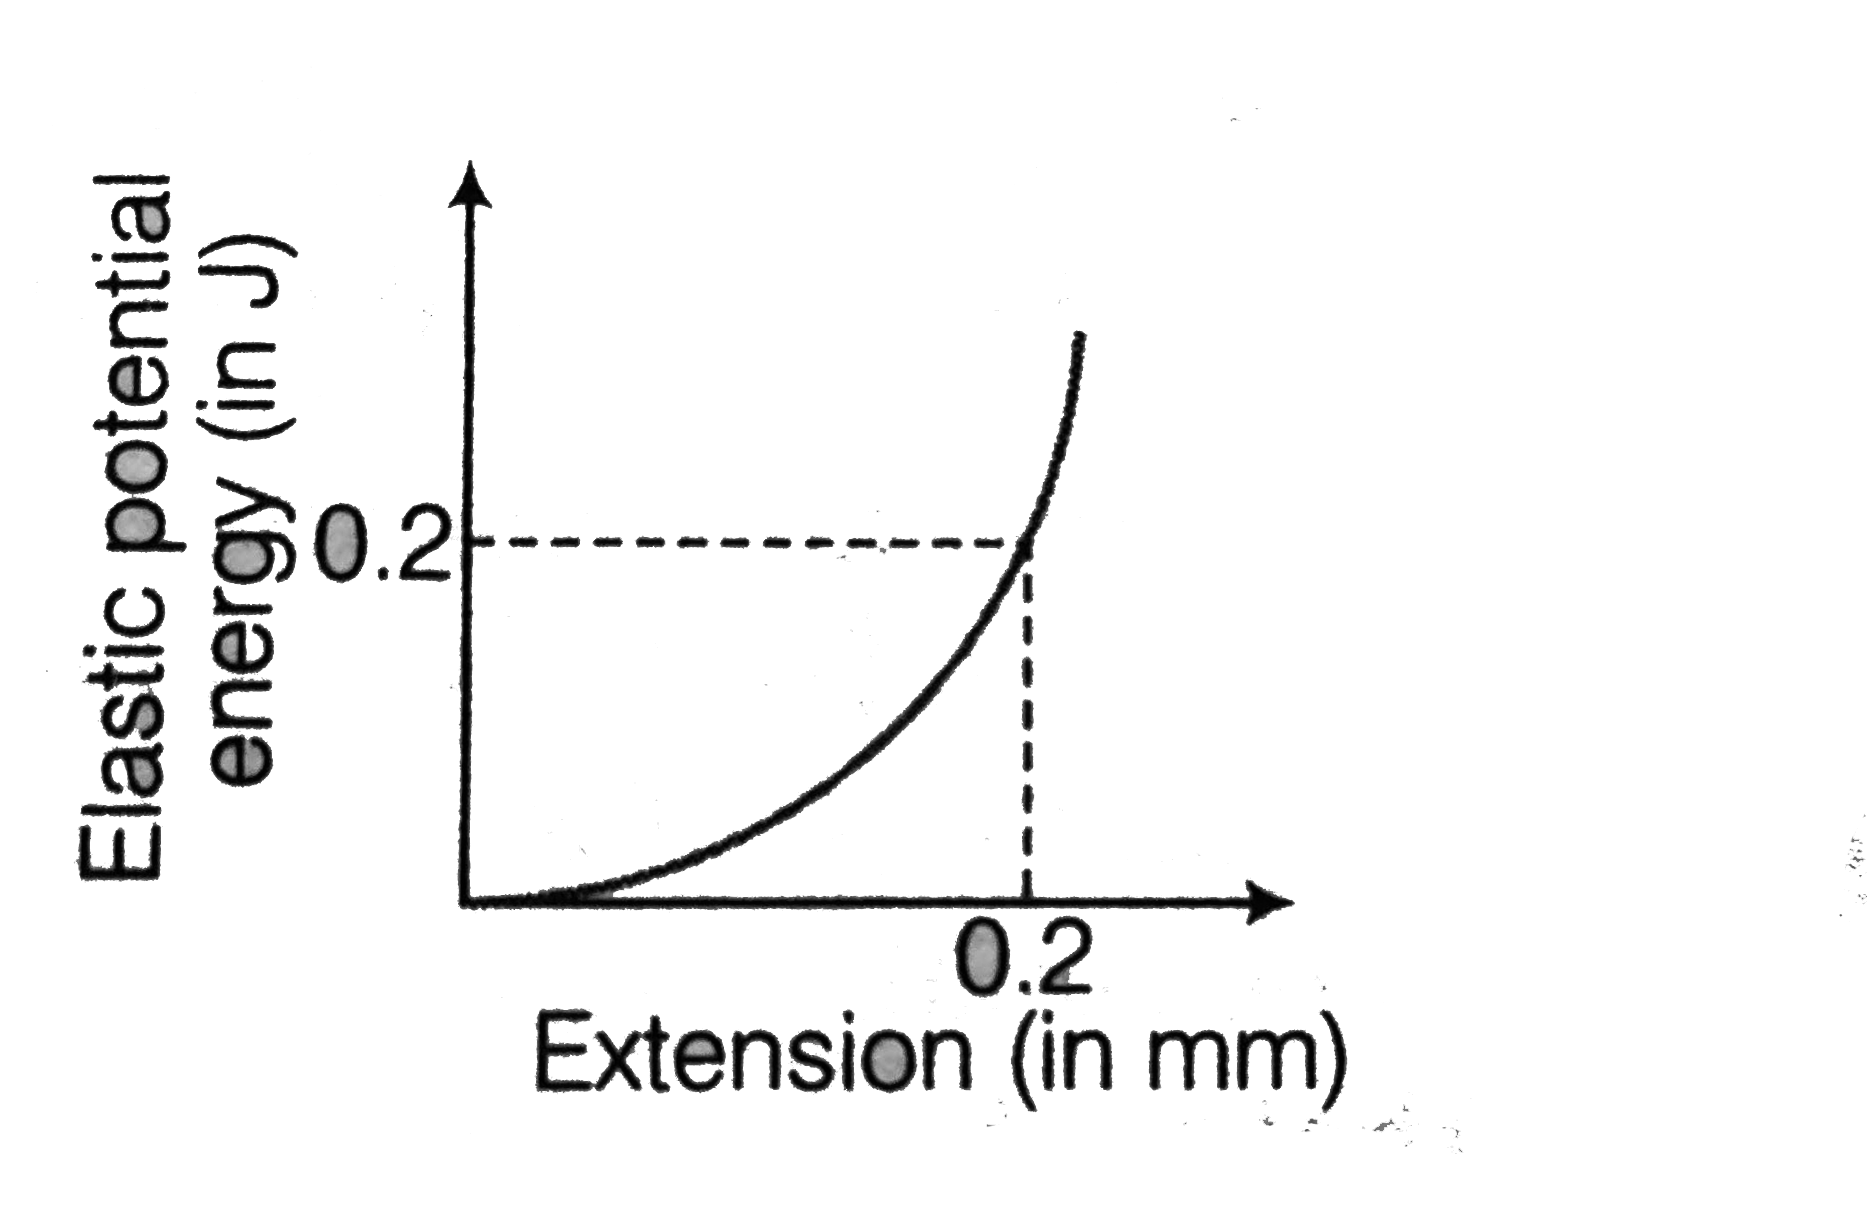
- Figure shows the graph of elastic potential energy (U) stored versus...
Text Solution
|
- A metal wire of length L, area of cross-section A and young's modulus ...
Text Solution
|
- Two wires A and B of same length are made of same material . The figur...
Text Solution
|
- A body of mass M is attached to the lower end of a metal wire, whose u...
Text Solution
|
- The wires A and B shown in Fig. are made of the same material and have...
Text Solution
|
- Two wires A and B have equal lengths and aremade of the same materia...
Text Solution
|
- A light rod of length of length 2 m is suspended from a ceiling horiz...
Text Solution
|
- A steel rod of cross-sectional area 16 cm^(2) and two brass rods each ...
Text Solution
|