A
B
C
D
Text Solution
Verified by Experts
The correct Answer is:


Topper's Solved these Questions
CALORIMETRY AND HEAT TRANSFER
DC PANDEY ENGLISH|Exercise Check points 16.3|20 VideosCALORIMETRY AND HEAT TRANSFER
DC PANDEY ENGLISH|Exercise Check points 16.4|29 VideosCALORIMETRY AND HEAT TRANSFER
DC PANDEY ENGLISH|Exercise Check point 16.1|10 VideosCALORIMETRY & HEAT TRANSFER
DC PANDEY ENGLISH|Exercise Level 2 Subjective|14 VideosCENTRE OF MASS
DC PANDEY ENGLISH|Exercise Medical entrances gallery|27 Videos
Similar Questions
Explore conceptually related problems
DC PANDEY ENGLISH-CALORIMETRY AND HEAT TRANSFER-Check point 16.2
- A substance of mass M kg requires a power input of P wants to remain i...
Text Solution
|
- 50 gram of ice at 0^(@)C is mixed with 50 gram of water at 60^(@)C , f...
Text Solution
|
- 80 g of water at 30^(@) C is mixed with 50 g of water at 60^(@) C, fin...
Text Solution
|
- An iron ball of mass 0.2 kg is heated to 10^(@)C and put into a block ...
Text Solution
|
- A steam at 100^@C is passed into 1 kg of water contained in a calorime...
Text Solution
|
- A lead bullet of 10g travelling at 300m//s strikes against a block of ...
Text Solution
|
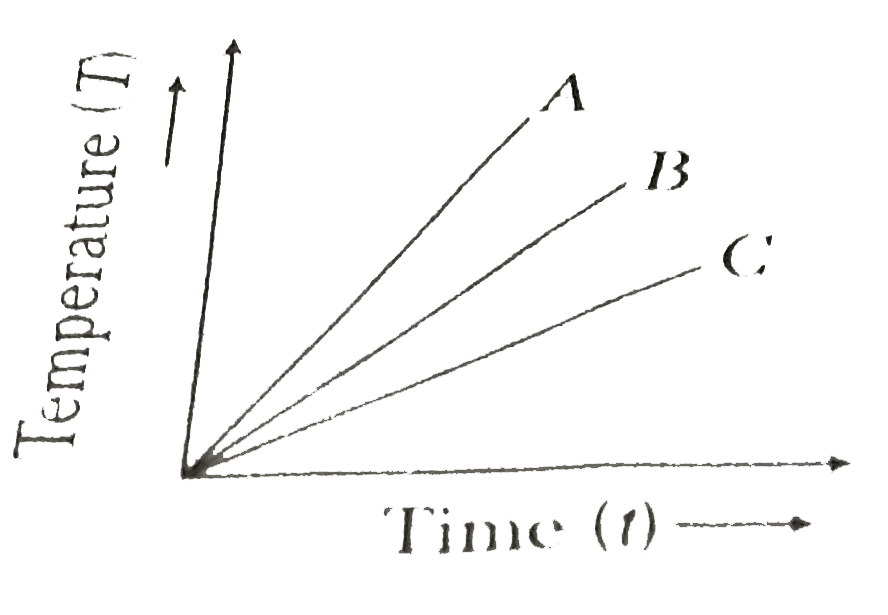
- The temperatures versus time graph is shown in figure. Which of the su...
Text Solution
|
- A solid material is supplied heat at a constant rate. The temperature...
Text Solution
|
- A student takes 50 g wax (specific heat =0.6 kcal//kg^(@)C) and heats ...
Text Solution
|
- 4 kg of ice at -15^(@)C are added to 5 kg of water at 15^(@)C . The te...
Text Solution
|