A
B
C
D
Text Solution
AI Generated Solution
The correct Answer is:


Topper's Solved these Questions
FLUID MECHANICS
DC PANDEY ENGLISH|Exercise Check point 13.4|10 VideosFLUID MECHANICS
DC PANDEY ENGLISH|Exercise Taking it together|157 VideosFLUID MECHANICS
DC PANDEY ENGLISH|Exercise Check point 13.2|10 VideosEXPERIMENTS
DC PANDEY ENGLISH|Exercise Subjective|15 VideosGENERAL PHYSICS
DC PANDEY ENGLISH|Exercise INTEGER_TYPE|2 Videos
Similar Questions
Explore conceptually related problems
DC PANDEY ENGLISH-FLUID MECHANICS-Check point 13.3
- The SI unit of viscosity coefficient is
Text Solution
|
- As the temperature of water increases, its viscosity
Text Solution
|
- The rate of flow of liquid in a tube of radius r, length l, whose ends...
Text Solution
|
- Two capillary tubes of lengths in the ratio 2 : 1 and radii in the rat...
Text Solution
|
- A small steel ball of radius r is allowed to fall under gravity throug...
Text Solution
|
- The ratio of the terminal velocities of two drops of radii R and R//2 ...
Text Solution
|
- An air bubble rises from the bottom of a lake of large depth. The risi...
Text Solution
|
- Two equal drops of water are falling through air with a steady velocit...
Text Solution
|
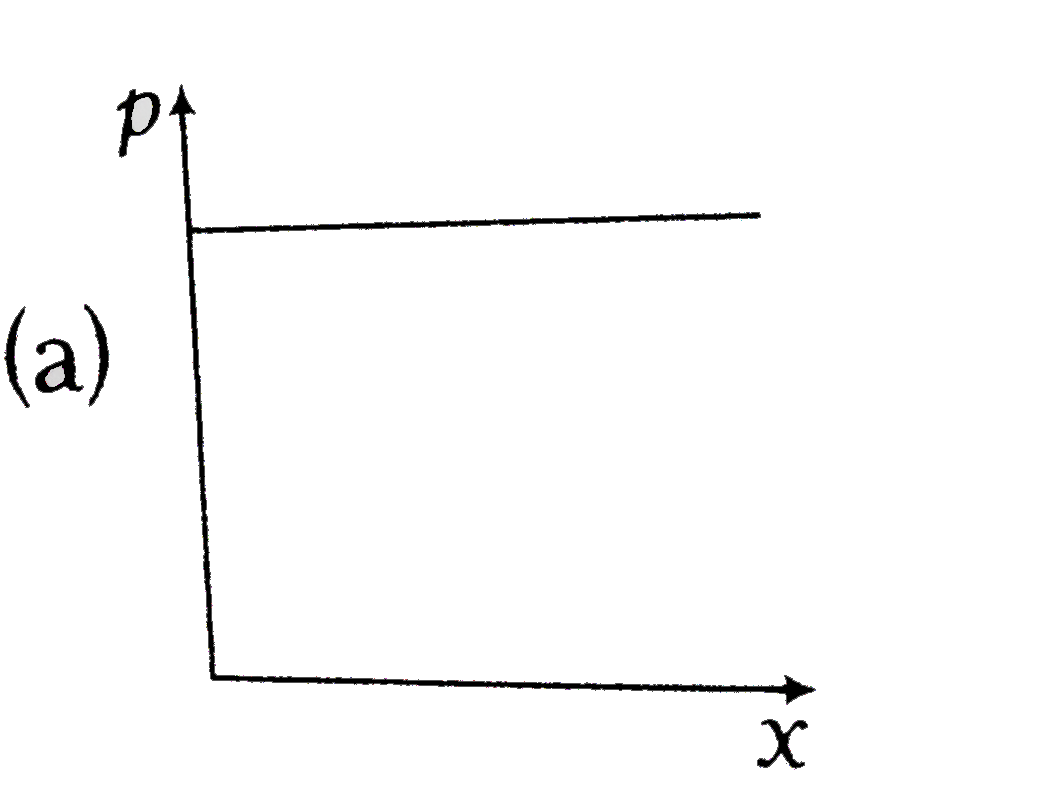
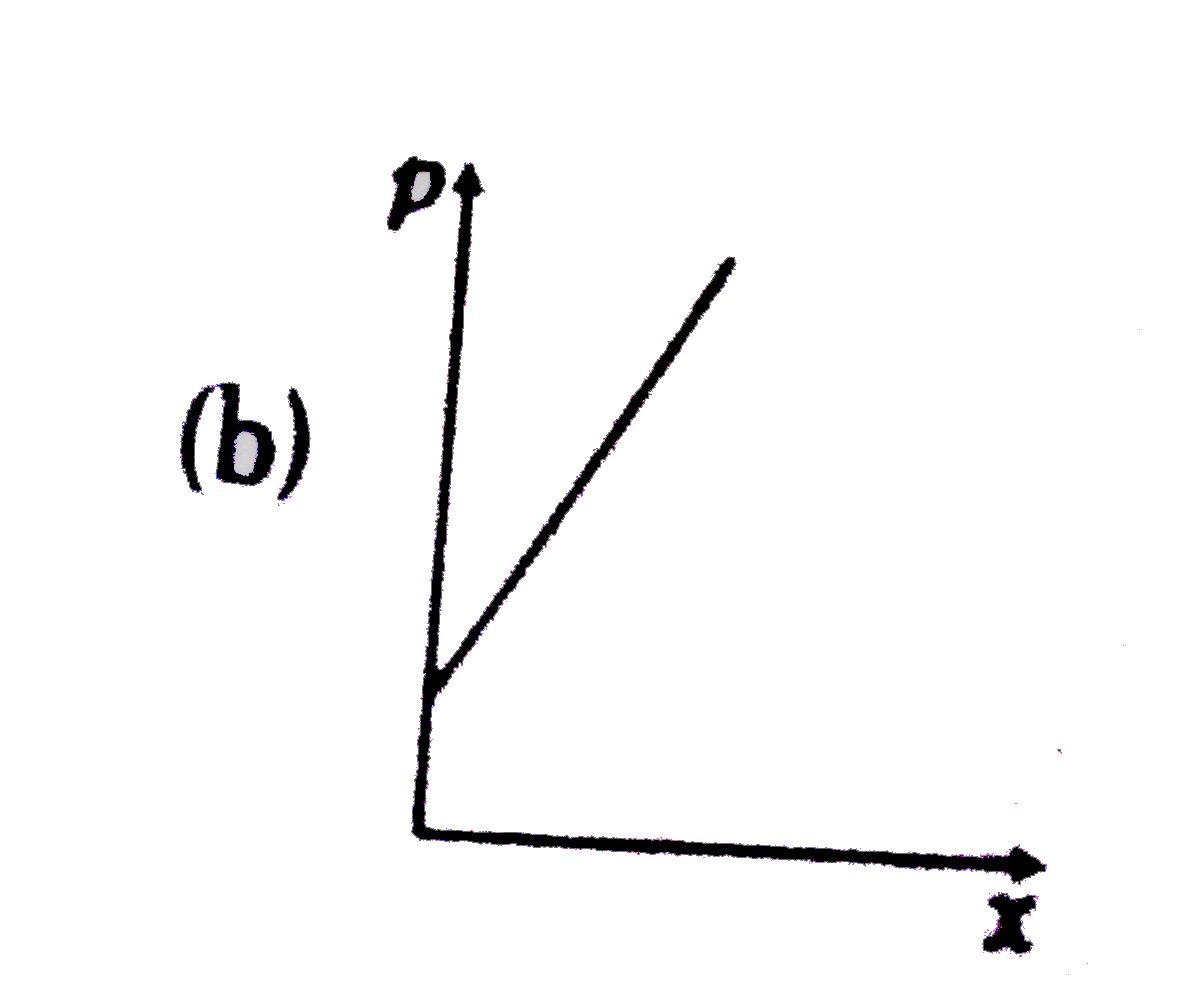
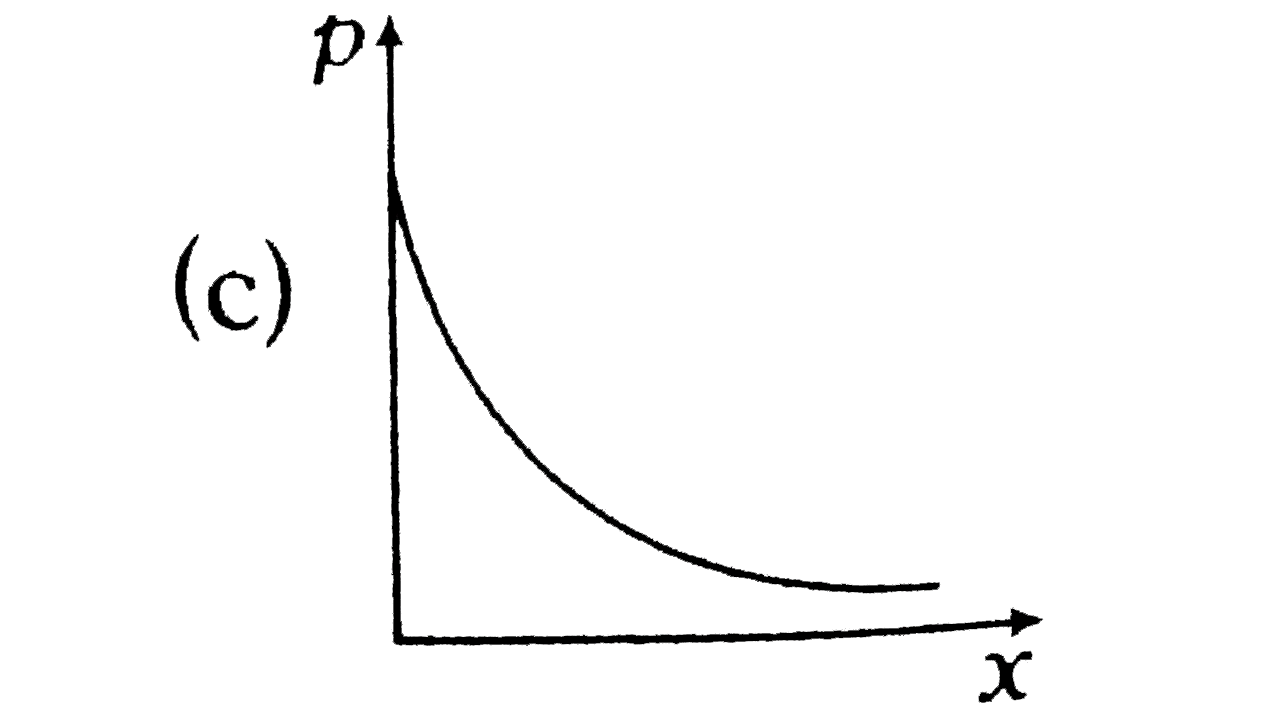
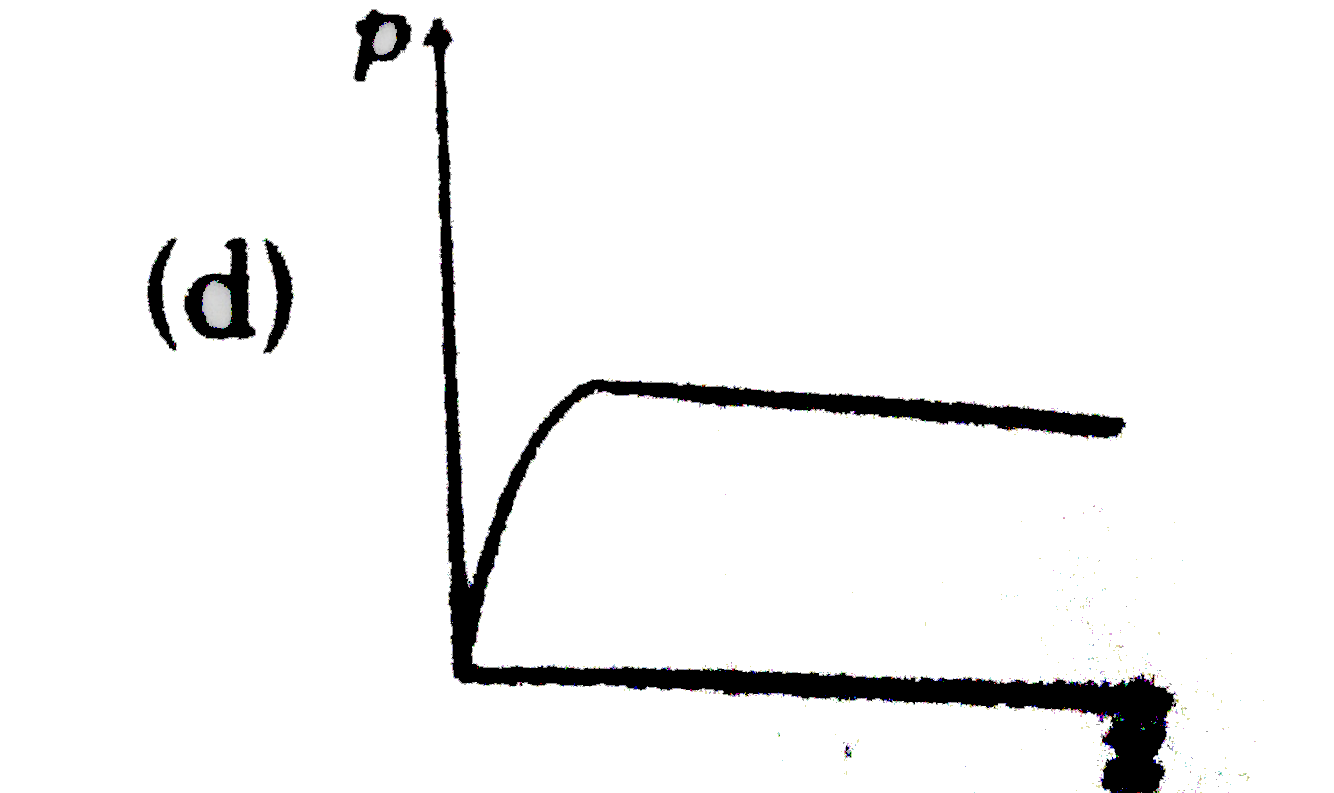
- From amongst the following curves, which one shows the variation of th...
Text Solution
|
- A spherical ball of radius 3xx10^(-4)m and density 10^(4)kg//m^(3) fal...
Text Solution
|