Text Solution
Verified by Experts


Topper's Solved these Questions
ANNUAL EXAM QUESTION PAPER MARCH-2020
SUNSTAR PUBLICATION|Exercise Part-B|8 VideosANNUAL EXAM QUESTION PAPER MARCH-2020
SUNSTAR PUBLICATION|Exercise Part-C|8 VideosANNUAL EXAM QUESTION PAPER MARCH -2015
SUNSTAR PUBLICATION|Exercise PART-A|37 VideosII PUC PHYSICS (P.U. BOARD LATEST MODEL QUESTIONS PAPER -2)
SUNSTAR PUBLICATION|Exercise PART-D|11 Videos
Similar Questions
Explore conceptually related problems
SUNSTAR PUBLICATION-ANNUAL EXAM QUESTION PAPER MARCH-2020-Part-D
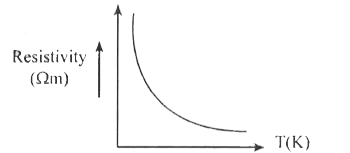
- Draw a plot showing the variation of resistivity of a (i) conductor a...
Text Solution
|
- Derive sigma = (n e^(2) tau)/(m) where the symbols have their usual ...
Text Solution
|
- Obtain an expression for the force between two straight parallel condu...
Text Solution
|
- Derive an Expression for instantaneous induced emf in an A.C generator
Text Solution
|
- Obtain the expression for fringe width in the case of interference of ...
Text Solution
|
- Derive an expression for the radius of n^(th) Bohr's orbit of hydrogen...
Text Solution
|
- What is Rectification? Describe with a circuit diagram the working of ...
Text Solution
|
- Two point charges q(A)= 5mu C and q(B)= -5muC are located at A and B s...
Text Solution
|
- (a) Three resistors 3Omega, 4Omega, and 12Omega are connected in paral...
Text Solution
|
- A series LCR circuit contains a pure inductor of inductance 5.0H, a ca...
Text Solution
|
- At what angle should a ray of light be incident on the face of a prism...
Text Solution
|
- A copper coin has a mass of 63.0g. Calculate the nuclear energy that w...
Text Solution
|