


ICSE-MODEL TEST PAPER 14 -SECTION C
- The price index of a commodity is 225. The percentage increase in pric...
Text Solution
|
- Given |vec (x1) | = 47.5 , |vec (x2)| = 52.5. and theta = 0 Then | ...
Text Solution
|
- Which percentile equals D7?
Text Solution
|
- P(50) = D5=QK = Median , then value of k is ?
Text Solution
|
- The Price relative and weight of a set of commoditities are given in t...
Text Solution
|
- Find coefficient of quartile deviation for the following data.
Text Solution
|
- The first of two samples has 100 times with mean 15 and standard devia...
Text Solution
|
- Calculate Karl Pearson's coefficient of correlations between the marks...
Text Solution
|
- The marks obtained in Mathematics and English are as follows. Calcula...
Text Solution
|
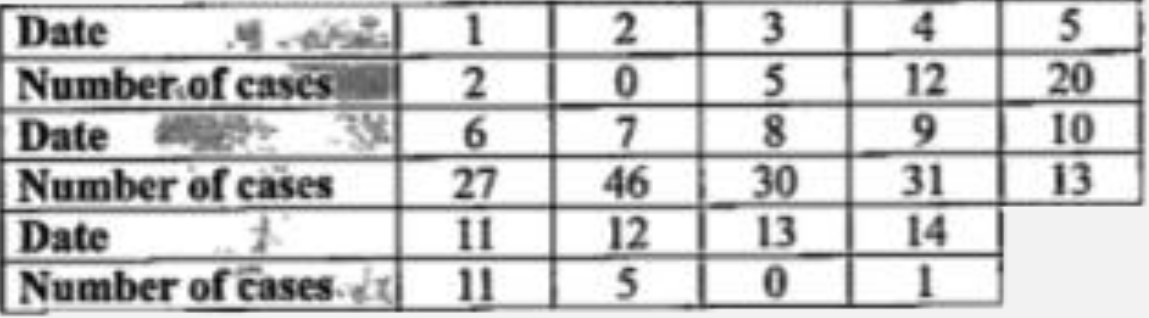
- In a typhoid epidemic ,the number of cases diagnosed were as follows. ...
Text Solution
|