


ICSE-ICSE ANNUAL EXAMINATION -2020-SECTION-II
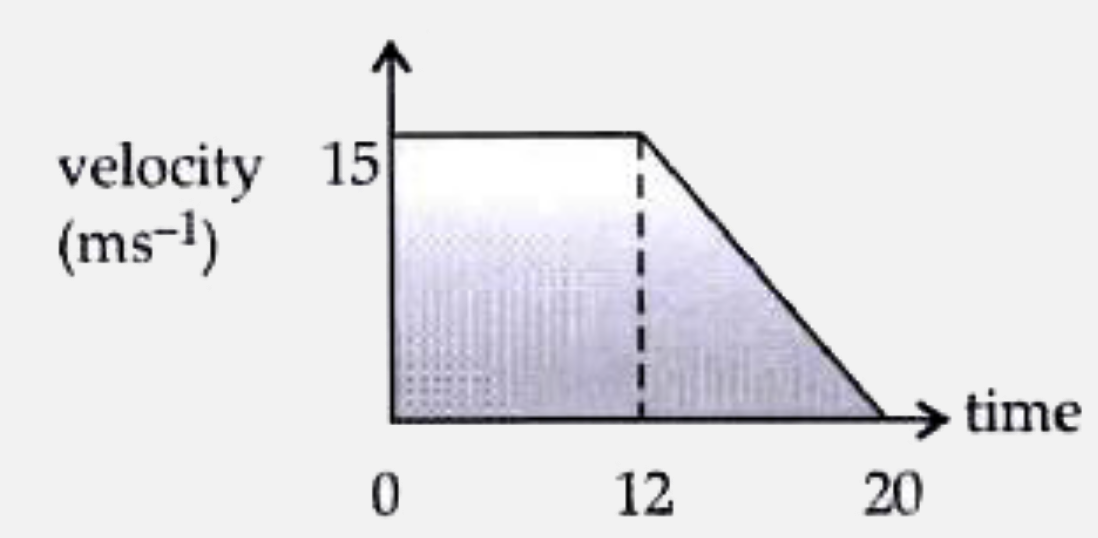
- The figure below shows the velocity-time graph of a body moving in a s...
Text Solution
|
- The figure below shows the velocity-time graph of a body moving in a s...
Text Solution
|
- The SI unit of length is represented by the Symbol .m.. What is the...
Text Solution
|
- When is a vernier callipers said to be free from zero error?
Text Solution
|
- Name the principle on which screw gauge works.
Text Solution
|
- Draw a graph (not to the scale) representing the variation of square o...
Text Solution
|
- If the length of a simple pendulum is increased to four times the init...
Text Solution
|
- A car travels from A to B and returns to its original position. The...
Text Solution
|
- A car travels from A to B and returns to its original position. The...
Text Solution
|
- A car travels from A to B and returns to its original position. The...
Text Solution
|
- A book is kept on the table as shown in the diagram. Copy the diagram ...
Text Solution
|
- Action and reaction act on the :
Text Solution
|
- State Newton.s second law of motion.
Text Solution
|
- Find the force exerted on a mass of 20 g if the acceleration produced ...
Text Solution
|
- The change in momentum of a body is represented by Deltap=m Deltav. ...
Text Solution
|
- Name and state the principle on which a hydraulic press works. Write o...
Text Solution
|
- The pressure exerted on the smaller and the larger piston of a hydraul...
Text Solution
|
- An altimeter is an aneroid barometer which makes use of the change in ...
Text Solution
|
- An altimeter is an aneroid barometer which makes use of the change in ...
Text Solution
|
- An altimeter is an aneroid barometer which makes use of the change in ...
Text Solution
|