A
B
C
D
Text Solution
Verified by Experts
The correct Answer is:


Topper's Solved these Questions
LIMITS
ARIHANT MATHS ENGLISH|Exercise Exercise (Passage Based Questions)|13 VideosLIMITS
ARIHANT MATHS ENGLISH|Exercise Exercise (Matching Type Questions)|3 VideosLIMITS
ARIHANT MATHS ENGLISH|Exercise Exercise (Single Option Correct Type Questions)|39 VideosINVERSE TRIGONOMETRIC FUNCTIONS
ARIHANT MATHS ENGLISH|Exercise Exercise (Questions Asked In Previous 13 Years Exam)|8 VideosLOGARITHM AND THEIR PROPERTIES
ARIHANT MATHS ENGLISH|Exercise Exercise (Questions Asked In Previous 13 Years Exam)|2 Videos
Similar Questions
Explore conceptually related problems
ARIHANT MATHS ENGLISH-LIMITS-Exercise (More Than One Correct Option Type Questions)
- If lim(x -> oo) 4x ( pi/4 - tan^-1 ((x+1) / (x+2))) = y^2 + 4y + 5 the...
Text Solution
|
- lim(xto0)(1-cos(x^(2)))/(x^(3)(4^(x)-1)) is equal to:
Text Solution
|
- If f(x)=e^([cotx]), where [y] represents the greatest integer less tha...
Text Solution
|
- lim(xto0)[m(sinx)/x] is equal to (where m epsilon I and [.] denotes gr...
Text Solution
|
- If ("lim")(xvec0)(1+a x+b x^2)^(2/x)=e^3, then find the value of aa n ...
Text Solution
|
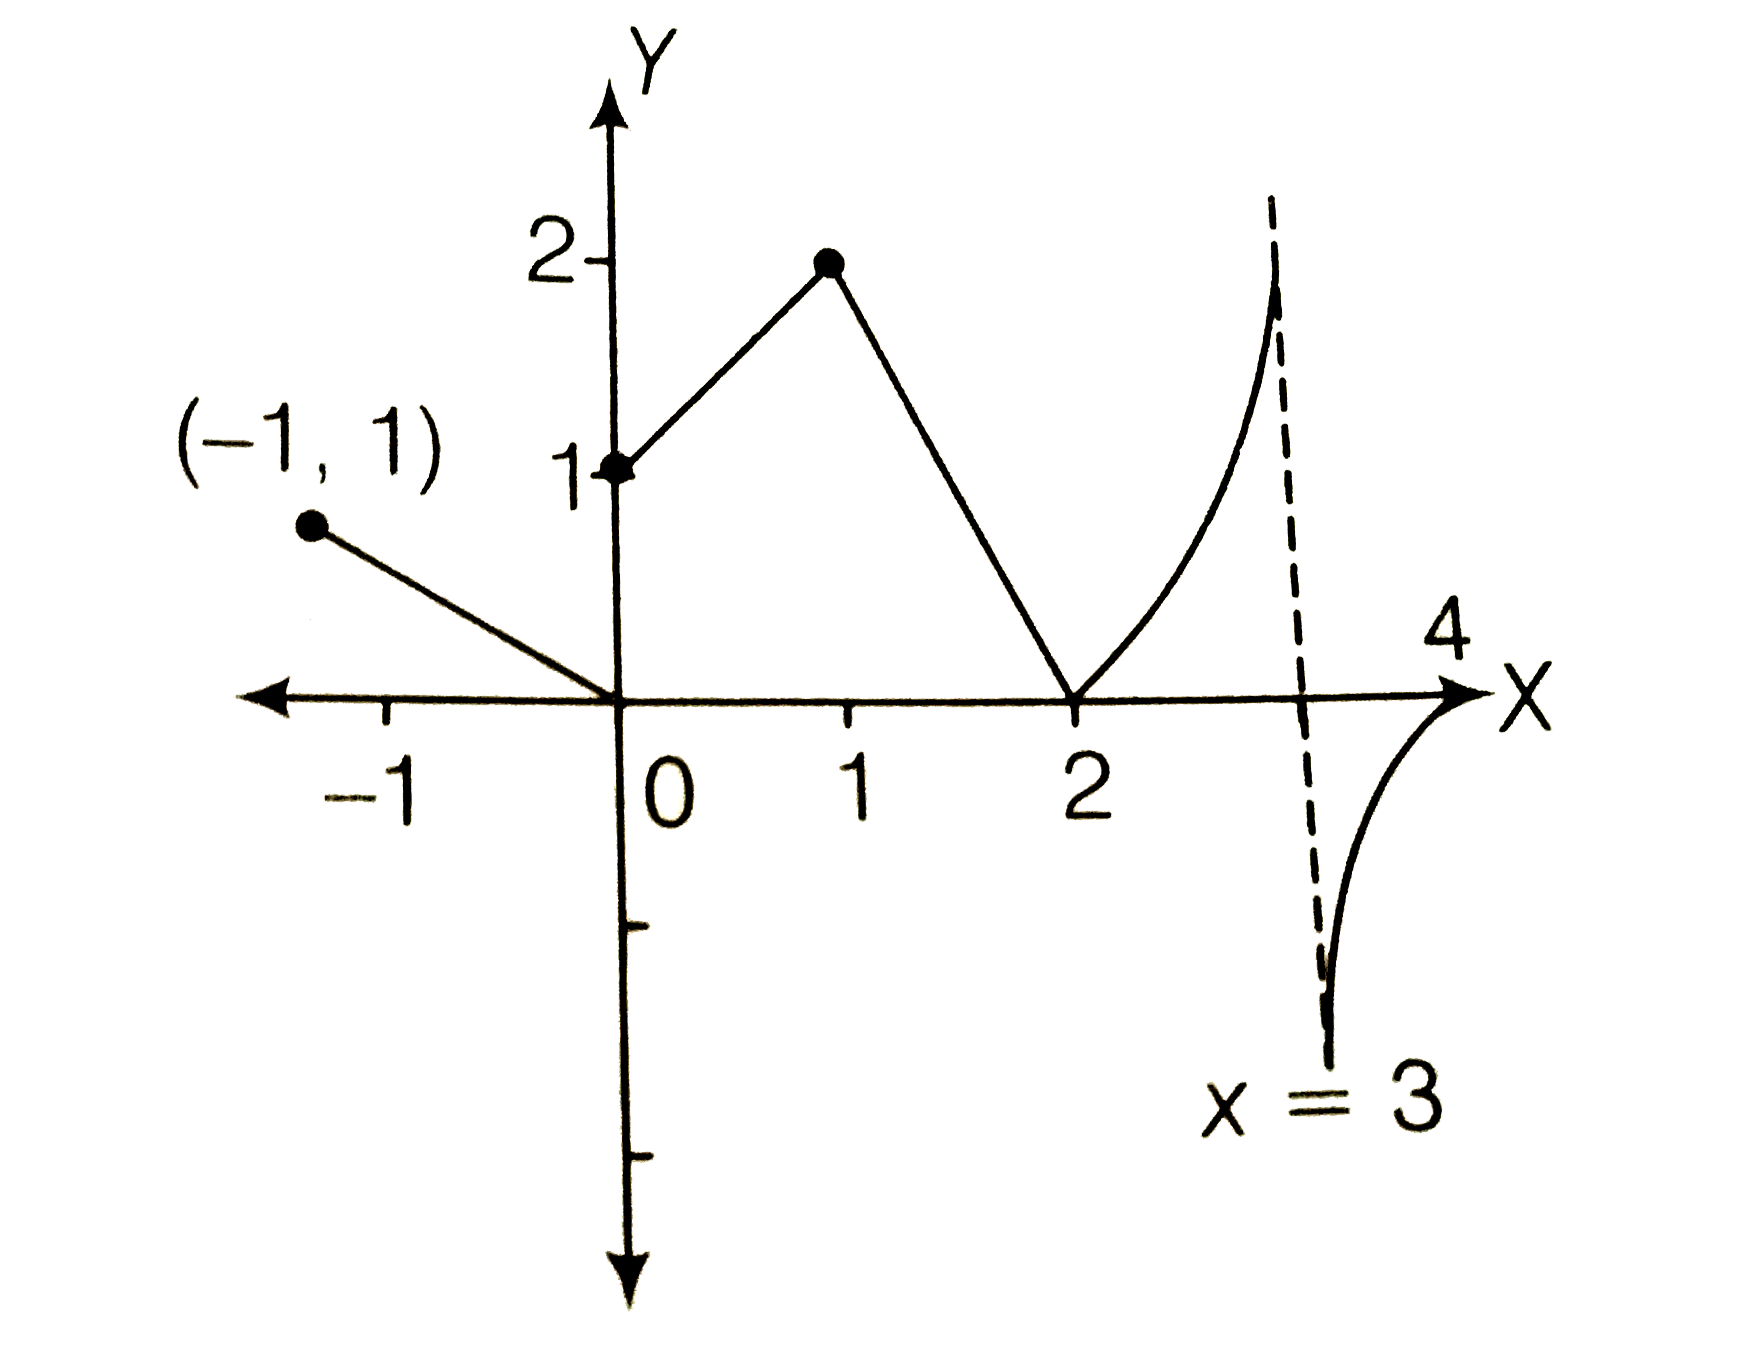
- The graph of the function y=f(x) is shown in the adjacent figure then ...
Text Solution
|
- Find lim(xto0)(cot^(-1)(1/x))/x
Text Solution
|
- If l=lim(xtooo)((x+1)/(x-1))^(x), the value of {l} and [l] are
Text Solution
|
- If f(x)={("sin"[x])/([x]),for[x]!=0, 0,for[x]=0,w h e r e[x] denotes ...
Text Solution
|
- lim(xtoc)f(x) does not exist when where [.] and {.} denotes greates...
Text Solution
|
- Identify the correct statement.
Text Solution
|
- For agt0, let l=lim(xto(pi)/2)(a^(cotx)-a^(cosx))/(cotx-cosx) and m=li...
Text Solution
|
- Consider the function f(x)=((ax+1)/(bx+2))^(x), where a,bgt0, the lim(...
Text Solution
|
- If f(x)=(x.2^(x)-x)/(1-cosx) and g(x)=2^(x).sin((log2)/(2^(x))) then
Text Solution
|
- If lim(xto3)(x^(3)+cx^(2)+5x+12)/(x^(2)-7x+12)=l (finite real number),...
Text Solution
|