 .
.Text Solution
Verified by Experts
 .
.  .
. 


Topper's Solved these Questions
Similar Questions
Explore conceptually related problems
CENGAGE PHYSICS ENGLISH-KINEMATICS-1-Integer
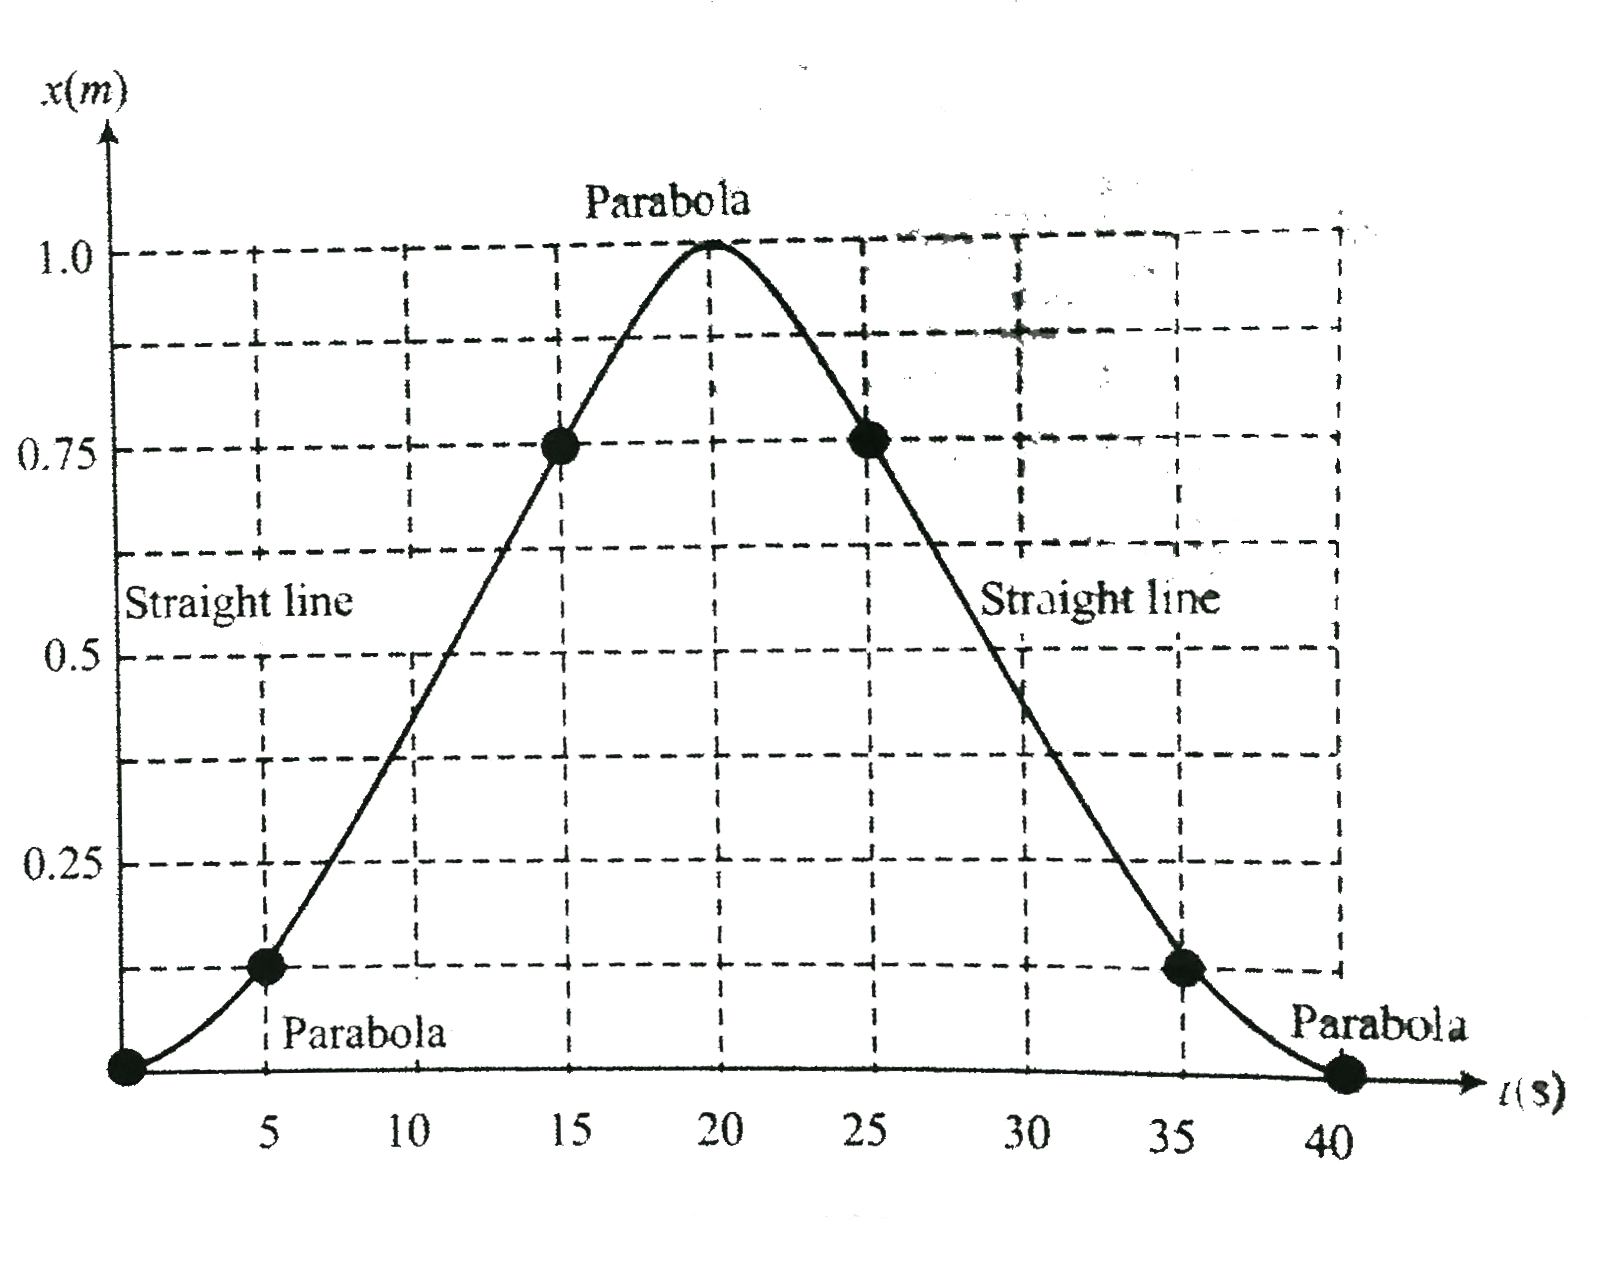
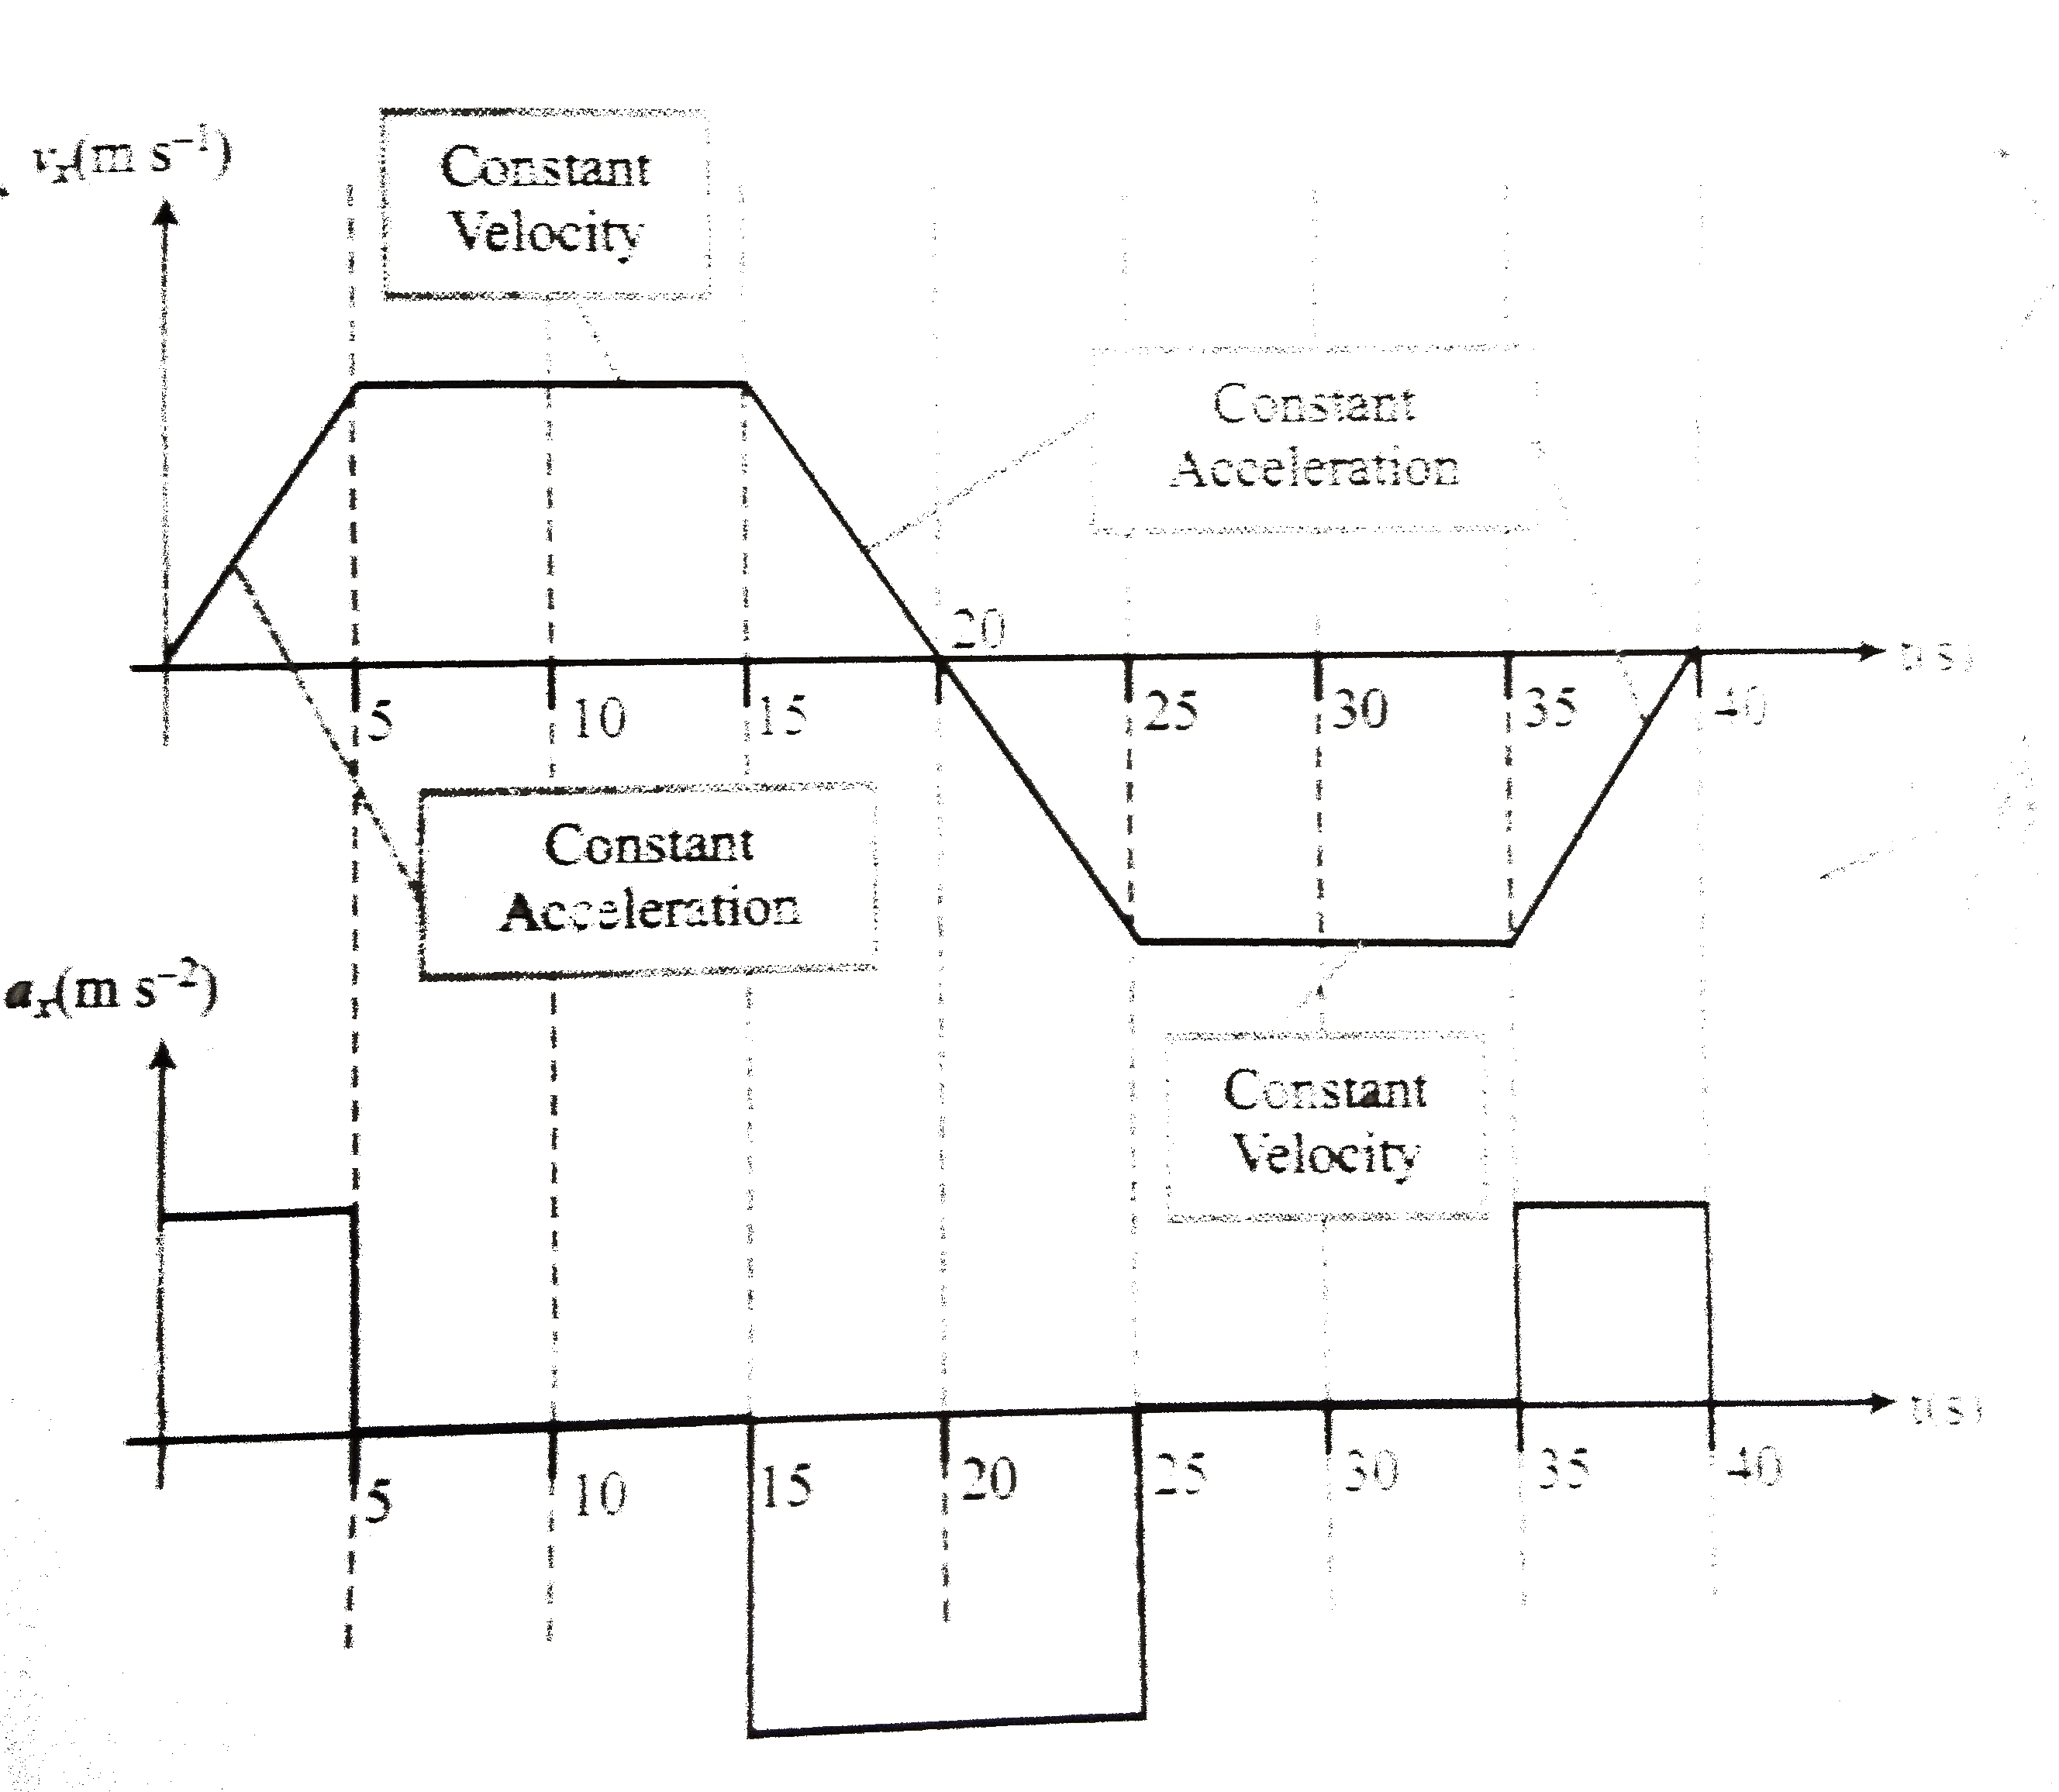
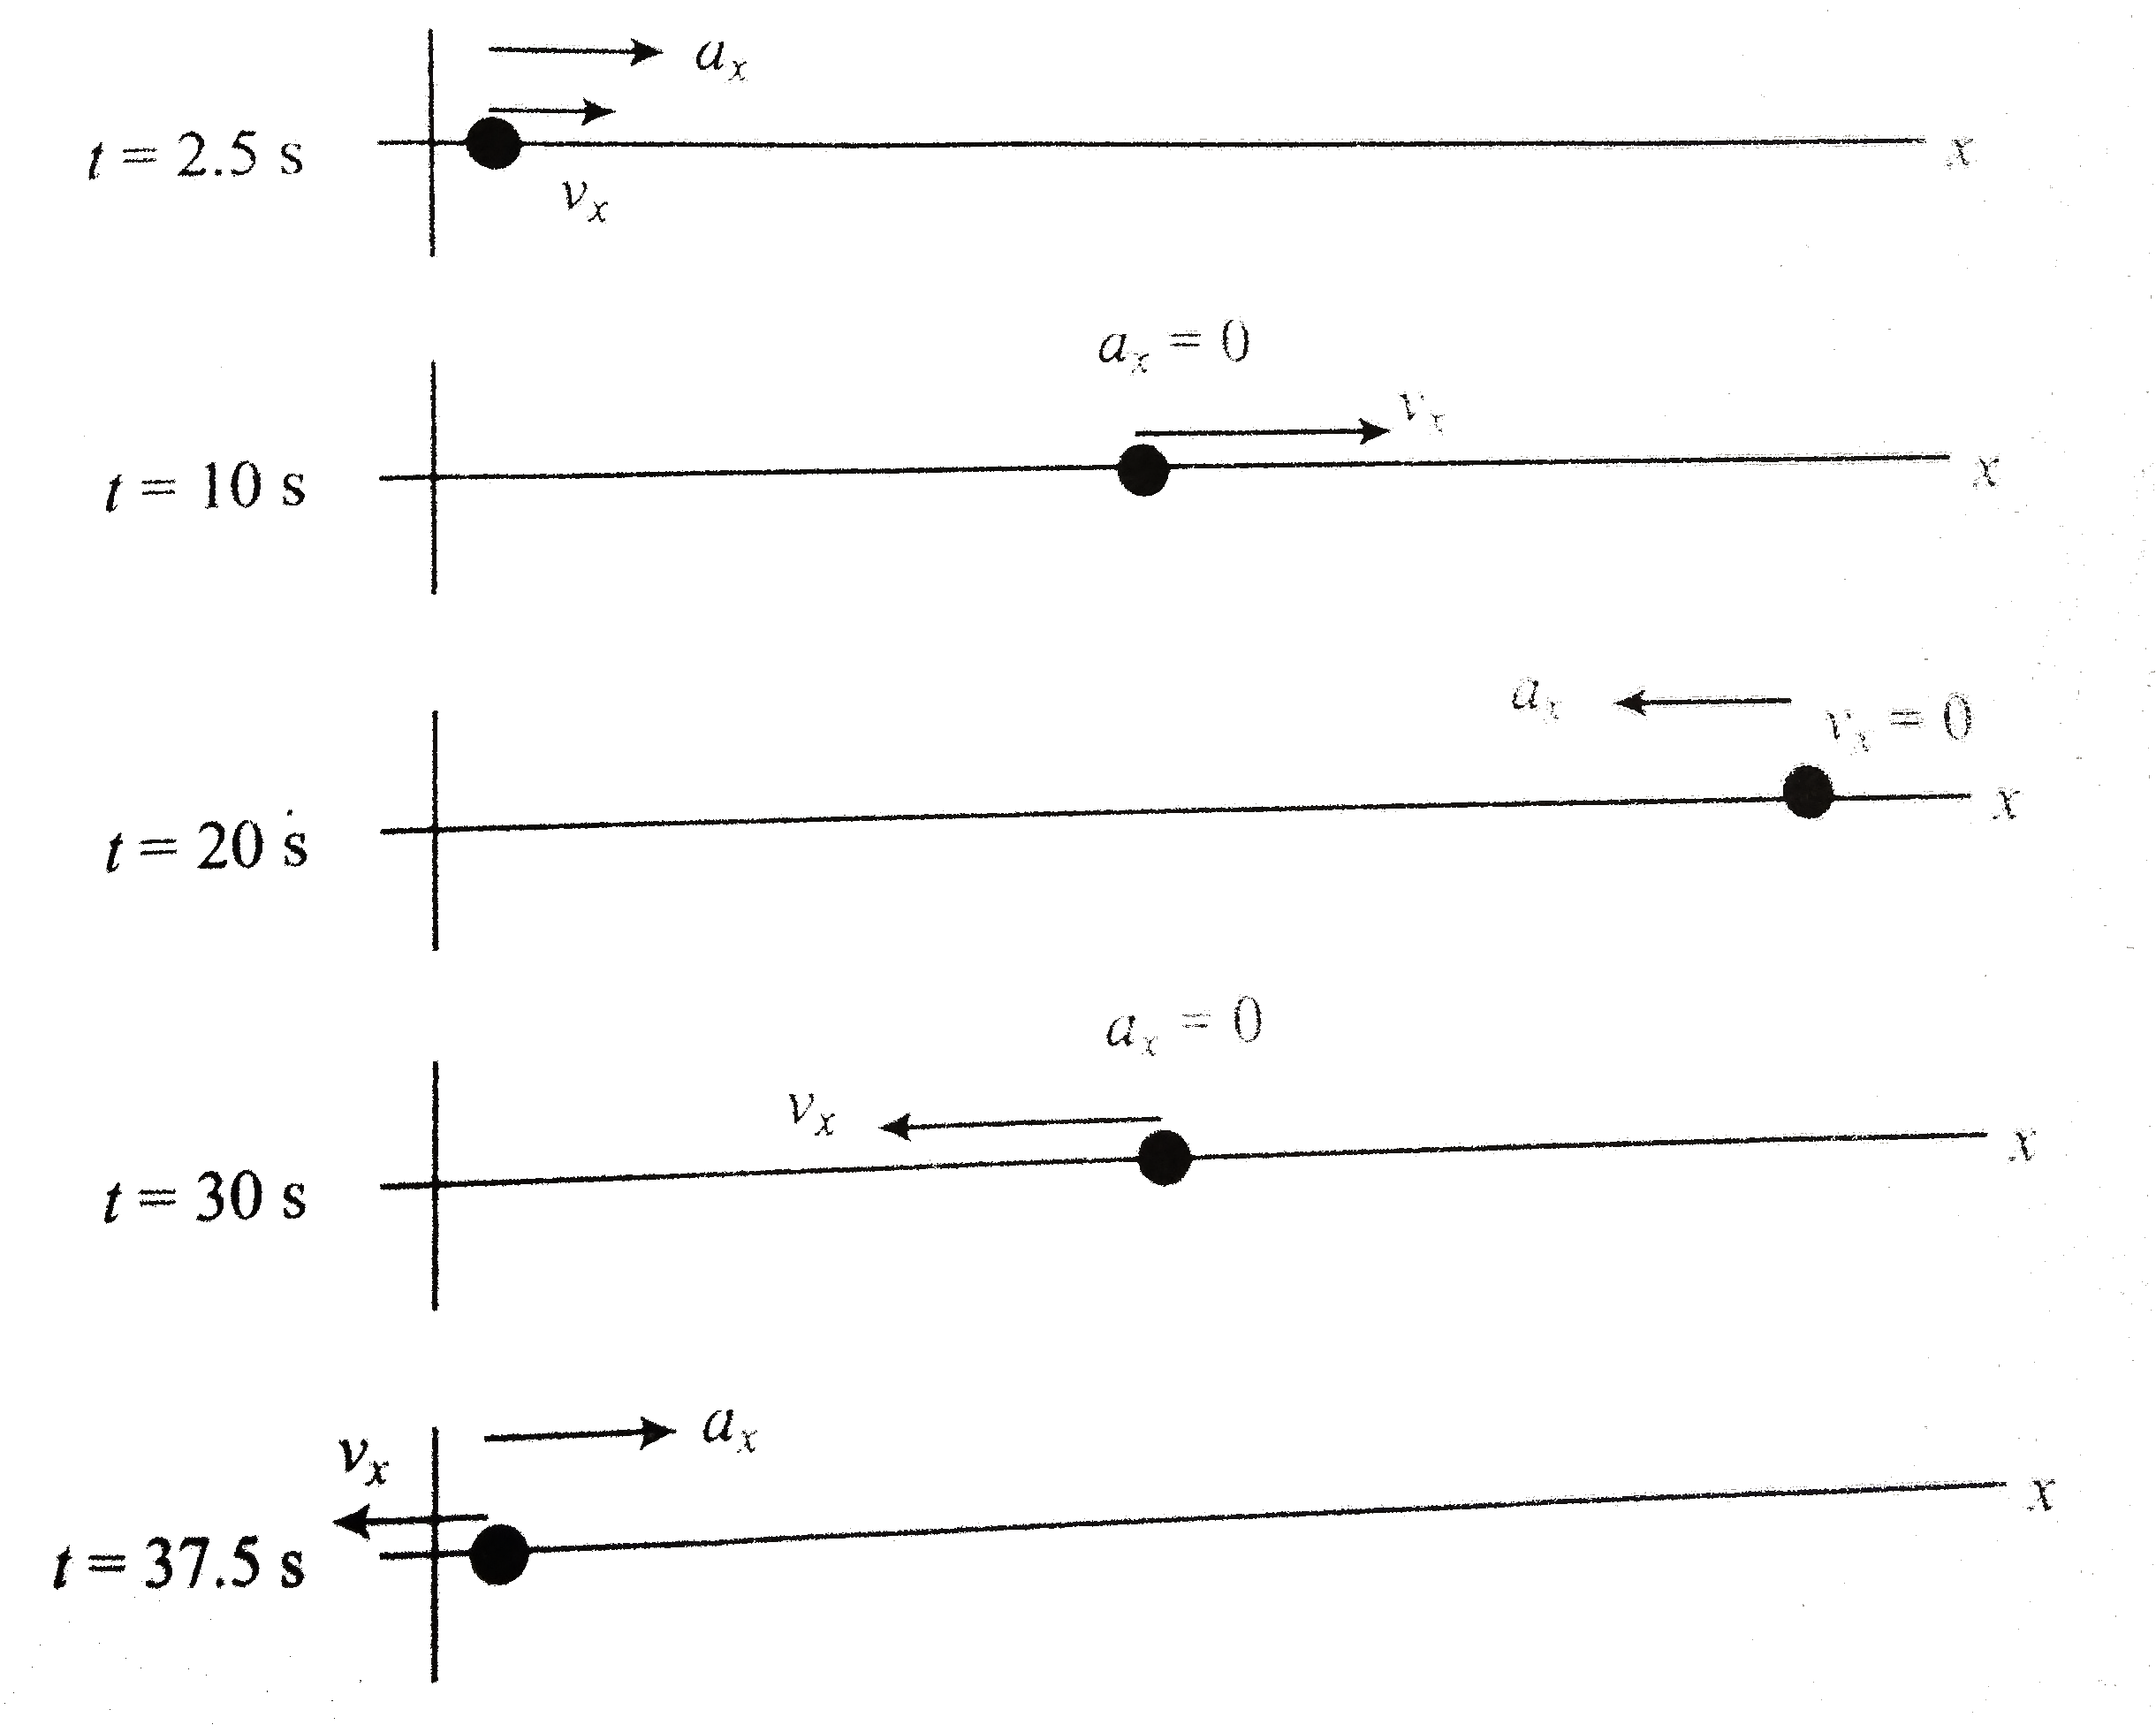
- Figure is a graph of the coordinate of a spider crawling along the x-a...
Text Solution
|
- A man in a lift ascending with an upward acceleration a throws a ball ...
Text Solution
|
- A train takes 2 h to reach station B from station A, and then 3 h to r...
Text Solution
|
- In a car race, car A takes 4 s less than can B at the finish and passe...
Text Solution
|
- A cat, on seeing a rat at a distance d=5 m, starts velocity u=5 m s^(-...
Text Solution
|
- A balloon rises rest on the ground with constant acceleration 1 m s^(-...
Text Solution
|
- A body is thrown up with a velocity 1000 m s^(-1). It travels 5 m in t...
Text Solution
|
- In quick succession, a large number of balls are thrown up vertically ...
Text Solution
|
- A police is chasing a culprit going in a motorbike. The motorbike cros...
Text Solution
|
- On a two lane road, car A is travelling with a speed of 36 km h^(-1). ...
Text Solution
|