Text Solution
Verified by Experts


Topper's Solved these Questions
ELECTRIC CURRENT AND CIRCUIT
CENGAGE PHYSICS ENGLISH|Exercise Solved Examples|12 VideosELECTRIC CURRENT AND CIRCUIT
CENGAGE PHYSICS ENGLISH|Exercise Exercise 5.1|28 VideosELECTRIC CURRENT & CIRCUITS
CENGAGE PHYSICS ENGLISH|Exercise Kirchhoff s law and simple circuits|15 VideosELECTRIC FLUX AND GAUSS LAW
CENGAGE PHYSICS ENGLISH|Exercise MCQ s|38 Videos
Similar Questions
Explore conceptually related problems
CENGAGE PHYSICS ENGLISH-ELECTRIC CURRENT AND CIRCUIT-Interger
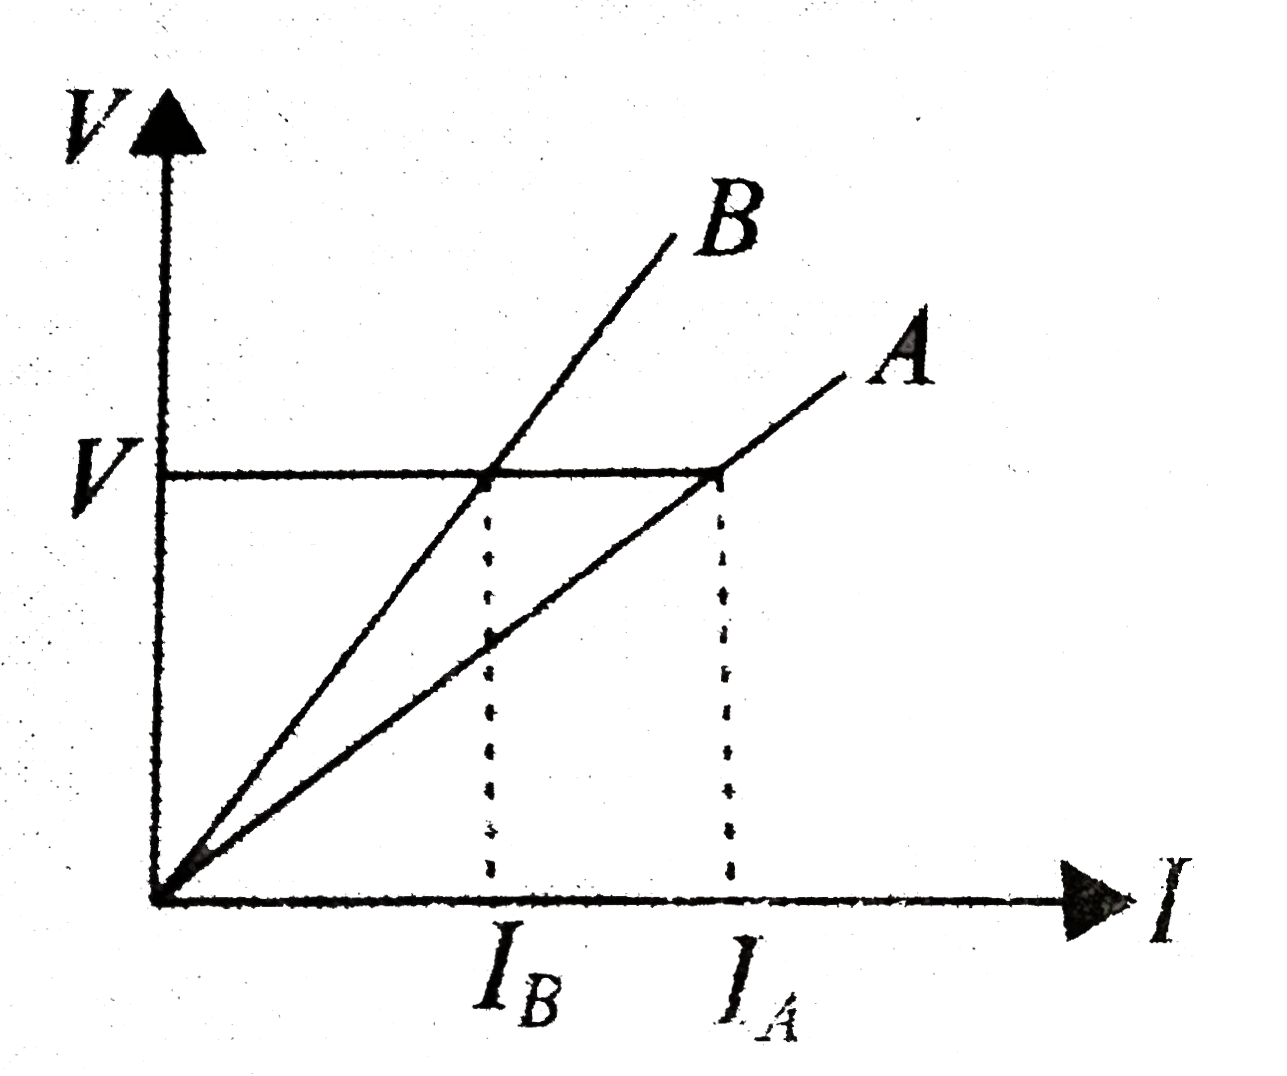
- The voltage-current graphs for two resistor of the same meterial and t...
Text Solution
|
- Nine wires each of resistance R are connected to make a prism as shown...
Text Solution
|
- Find the potential difference (inV) between points A and B shown in th...
Text Solution
|
- If the switches S1,S2, and S3 fig. are arranged such that the current ...
Text Solution
|
- A finite square grid, each link having resistance r, is fitted in a re...
Text Solution
|
- In the infinite gride. If the value of r = 2 (sqrt(5 - 1)) Omega. Find...
Text Solution
|
- The potential difference VA - VB for the circuit shown in fig. is. -(2...
Text Solution
|
- In the circuit shown, each resistance is 2Omega. The potential V1 is a...
Text Solution
|
- The area of cross-section, length and density of a piece of a metal of...
Text Solution
|