A
B

C
D
Text Solution
AI Generated Solution
The correct Answer is:


Topper's Solved these Questions
PHOTOELECTRIC EFFECT
CENGAGE PHYSICS ENGLISH|Exercise Multiple Correct|10 VideosPHOTOELECTRIC EFFECT
CENGAGE PHYSICS ENGLISH|Exercise Linked Comprehension|44 VideosPHOTOELECTRIC EFFECT
CENGAGE PHYSICS ENGLISH|Exercise Subjective|16 VideosNUCLEAR PHYSICS
CENGAGE PHYSICS ENGLISH|Exercise ddp.5.5|14 VideosRAY OPTICS
CENGAGE PHYSICS ENGLISH|Exercise DPP 1.6|12 Videos
Similar Questions
Explore conceptually related problems
CENGAGE PHYSICS ENGLISH-PHOTOELECTRIC EFFECT-Single Correct
- Electrons taveling at a velocity of 2.4xx10^(6) ms^(-1) enter a region...
Text Solution
|
- A surface irradiated with light of wavelength 480 nm gives out electro...
Text Solution
|
- In an experiment on the photoelectric effect, an evecuated photocell w...
Text Solution
|
- A metal surface in an evacuated tube is illuminated with monochromatic...
Text Solution
|
- If stopping potentials corresponding to wavelengths 4000A and 4500A ar...
Text Solution
|
- The photoelectric threshold of a certain metal is 3000A. If the radiat...
Text Solution
|
- The frequency and the intensity of a beam of light falling on the surf...
Text Solution
|
- The frequency of incident light falling on a photosensitive metal plat...
Text Solution
|
- Two radiations of photons energies 1 eV and 2.5 eV, successively illum...
Text Solution
|
- A proton when accelerated through a potential difference of V volt has...
Text Solution
|
- Given that a photon of light of wavelength 10,000A has an energy equal...
Text Solution
|
- In the previous question, if the intensity of light is made 4I0, then ...
Text Solution
|
- if the intensity of light is made 4I0, then the saturation current wil...
Text Solution
|
- if the cathode and the anode are kept at the same potential, the emitt...
Text Solution
|
- if the wavelength is chaged from4000A. to 3000A, then stopping potenti...
Text Solution
|
- A light source is at a distance d from a photoelectric cell, then the ...
Text Solution
|
- If 5% of the energy supplied to a bulb is irradiated as visible light,...
Text Solution
|
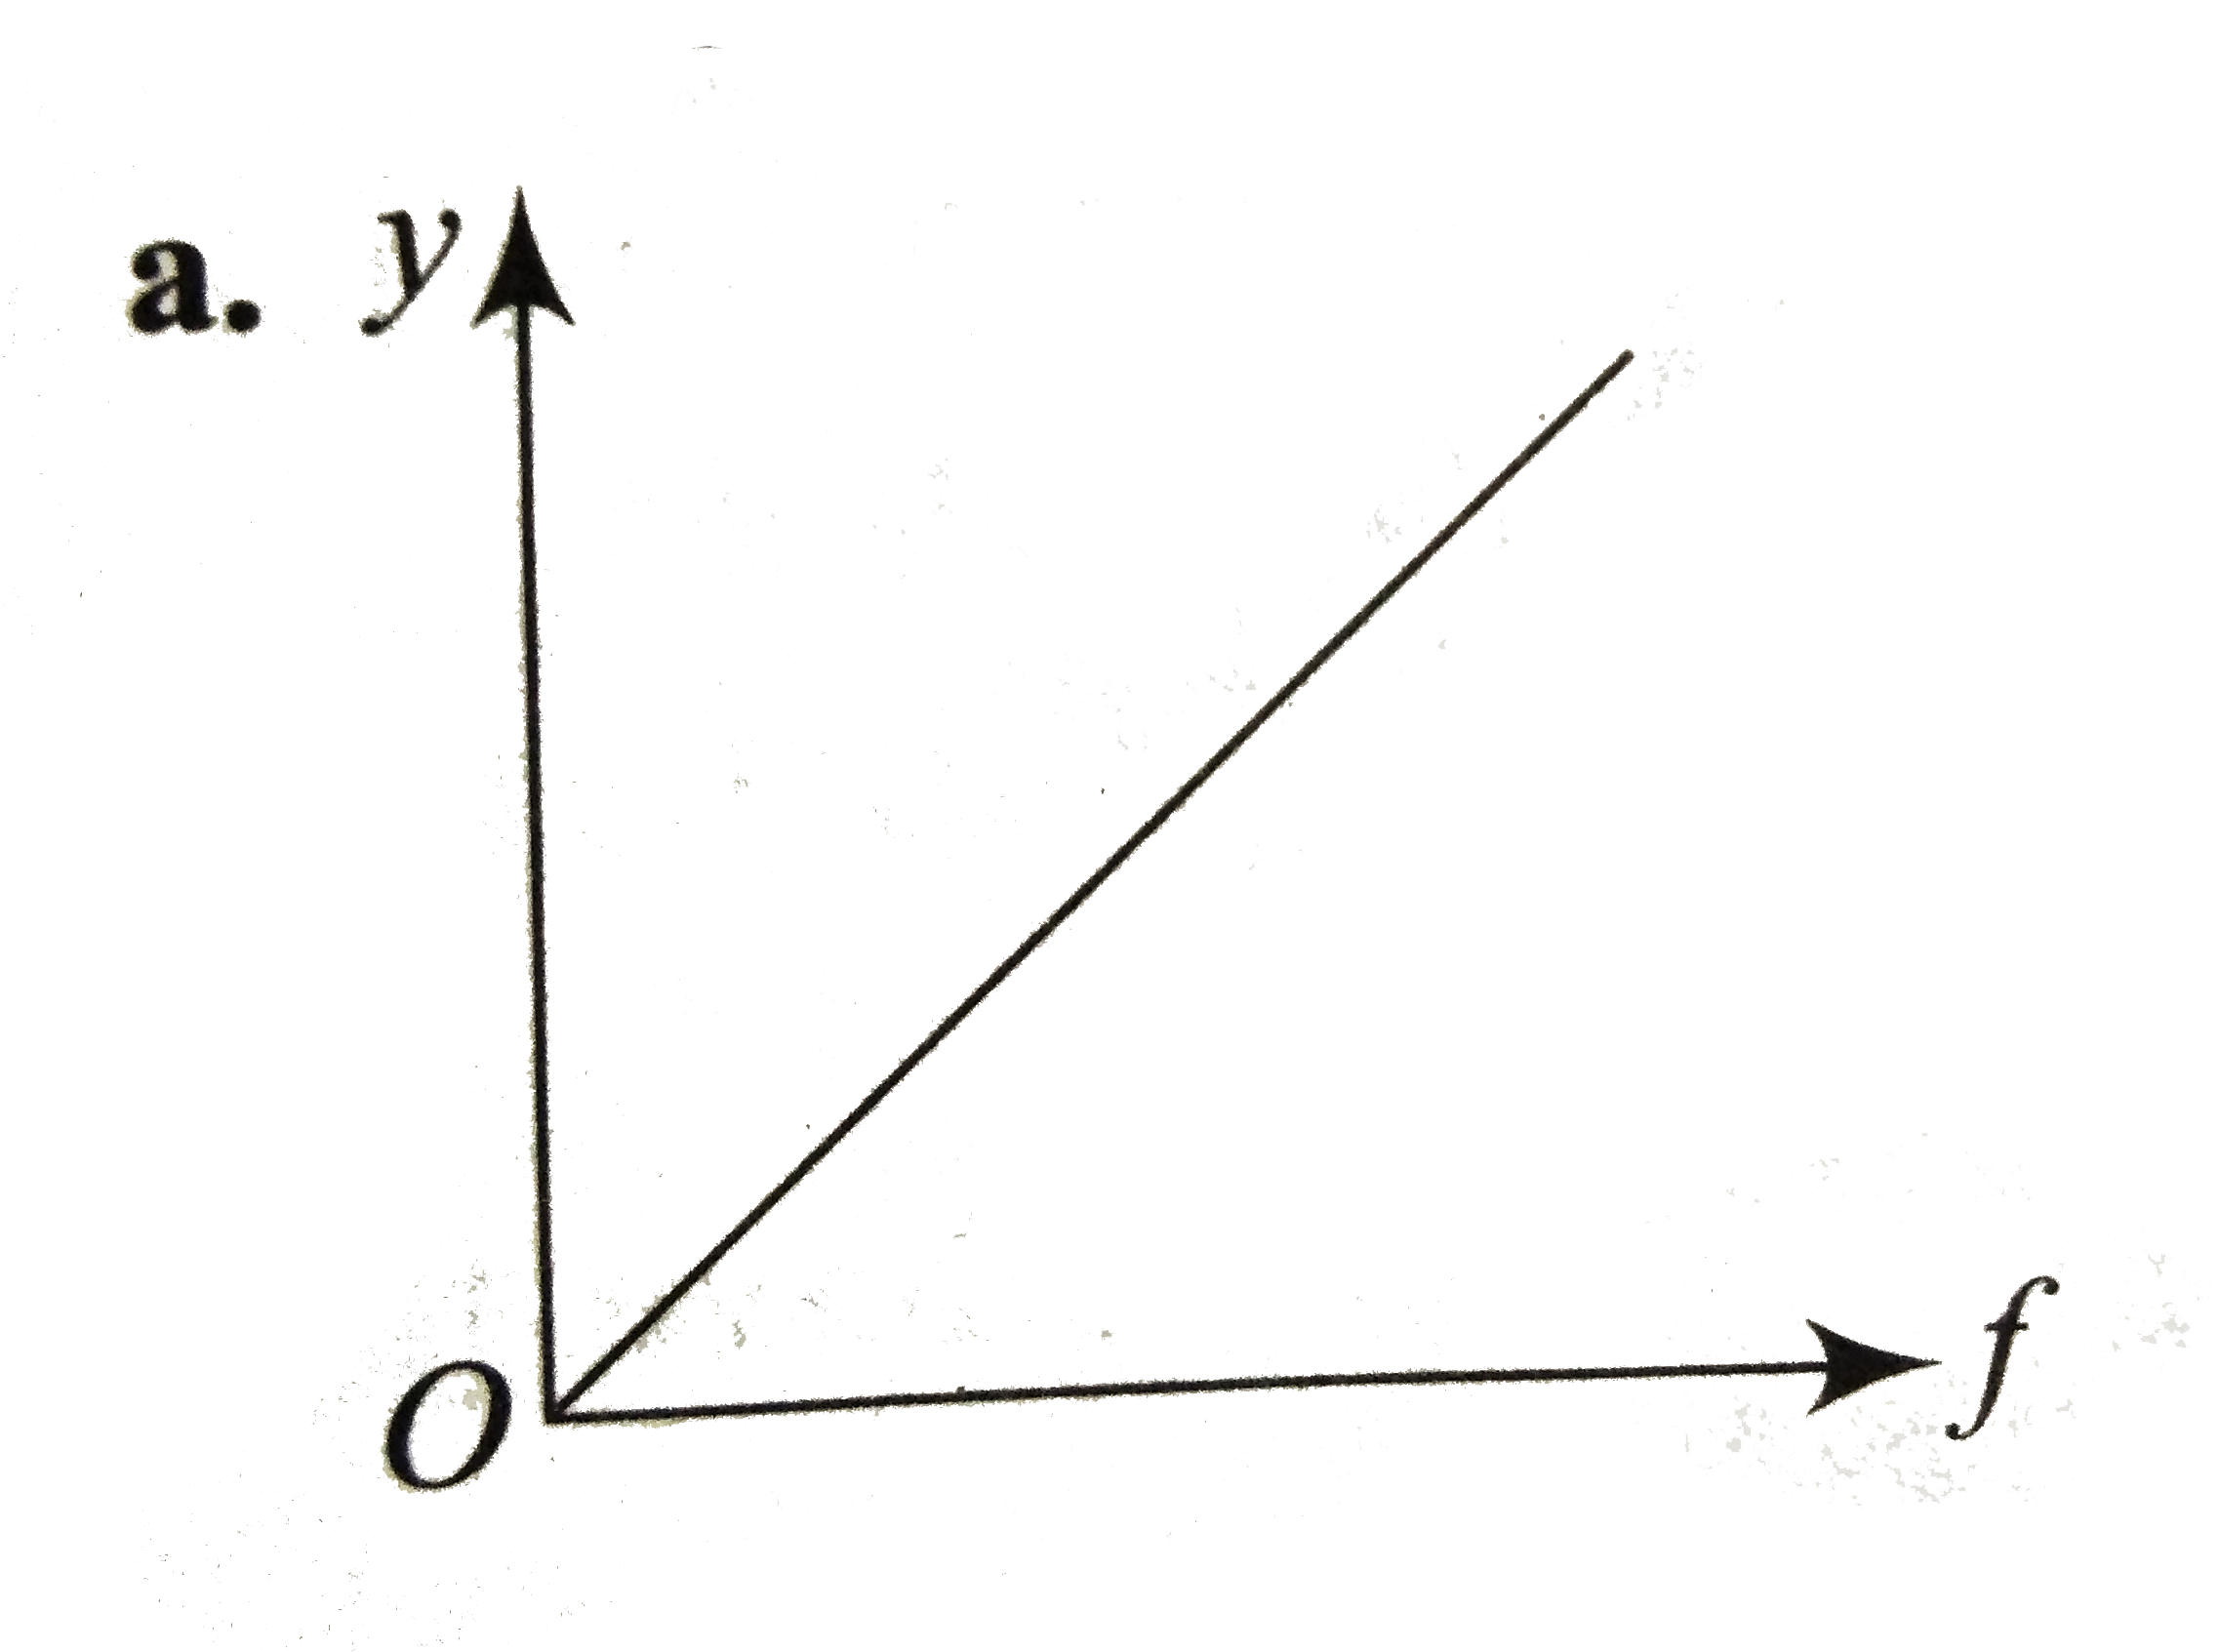
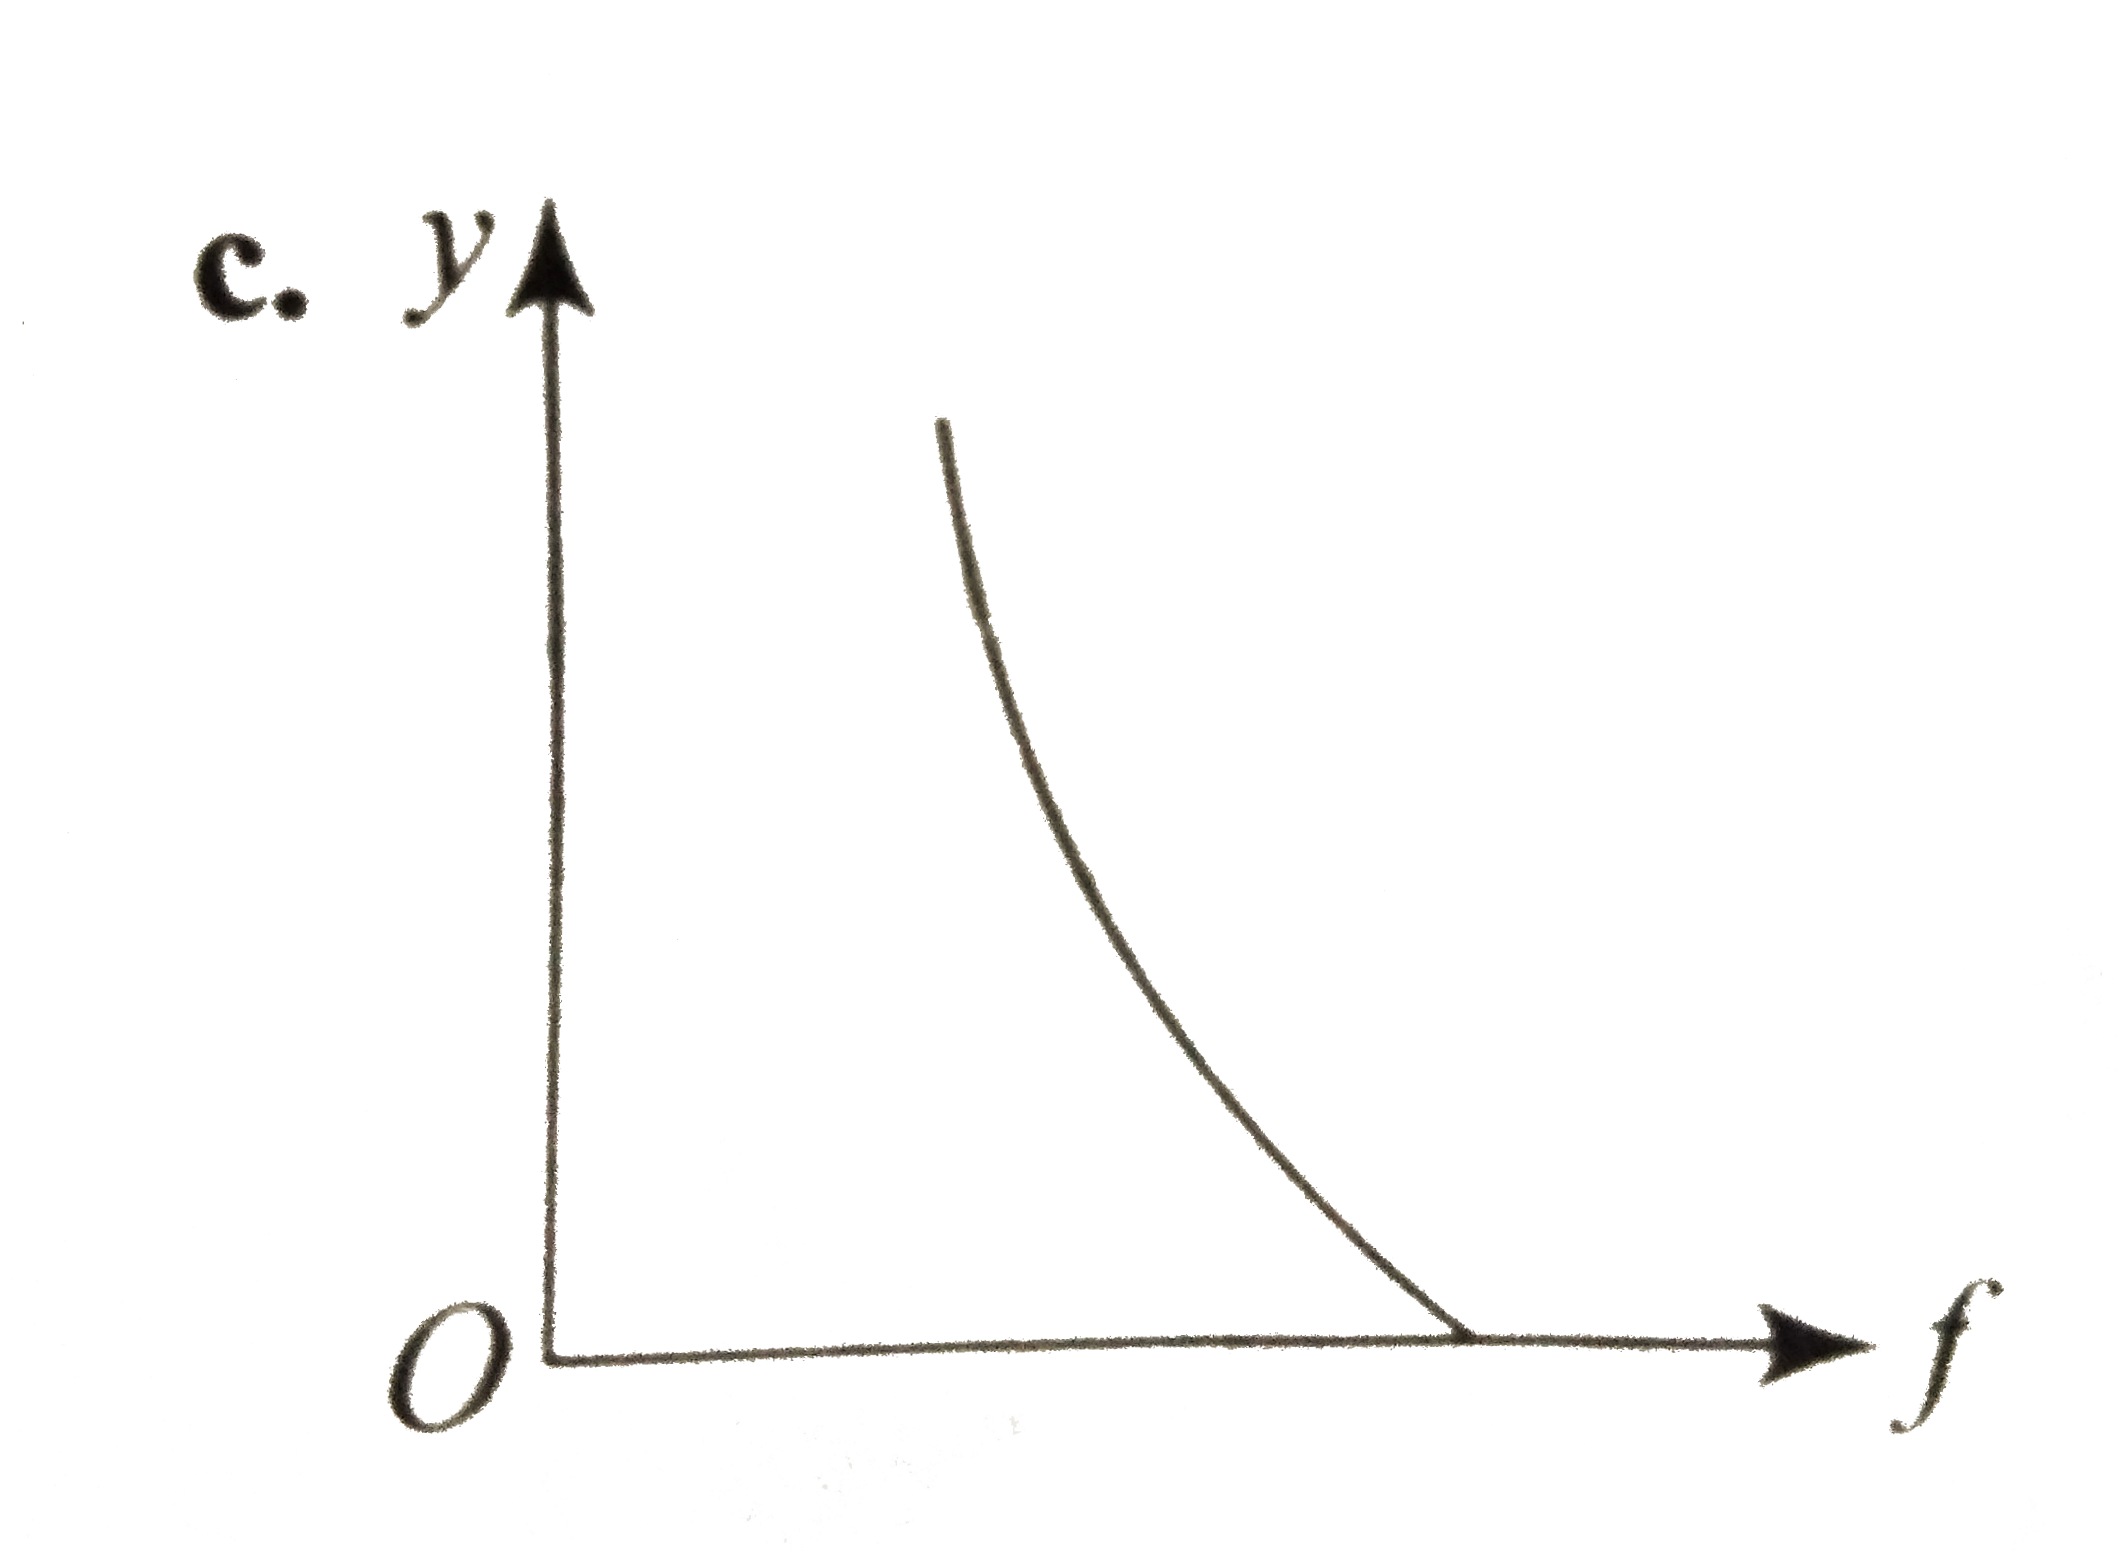
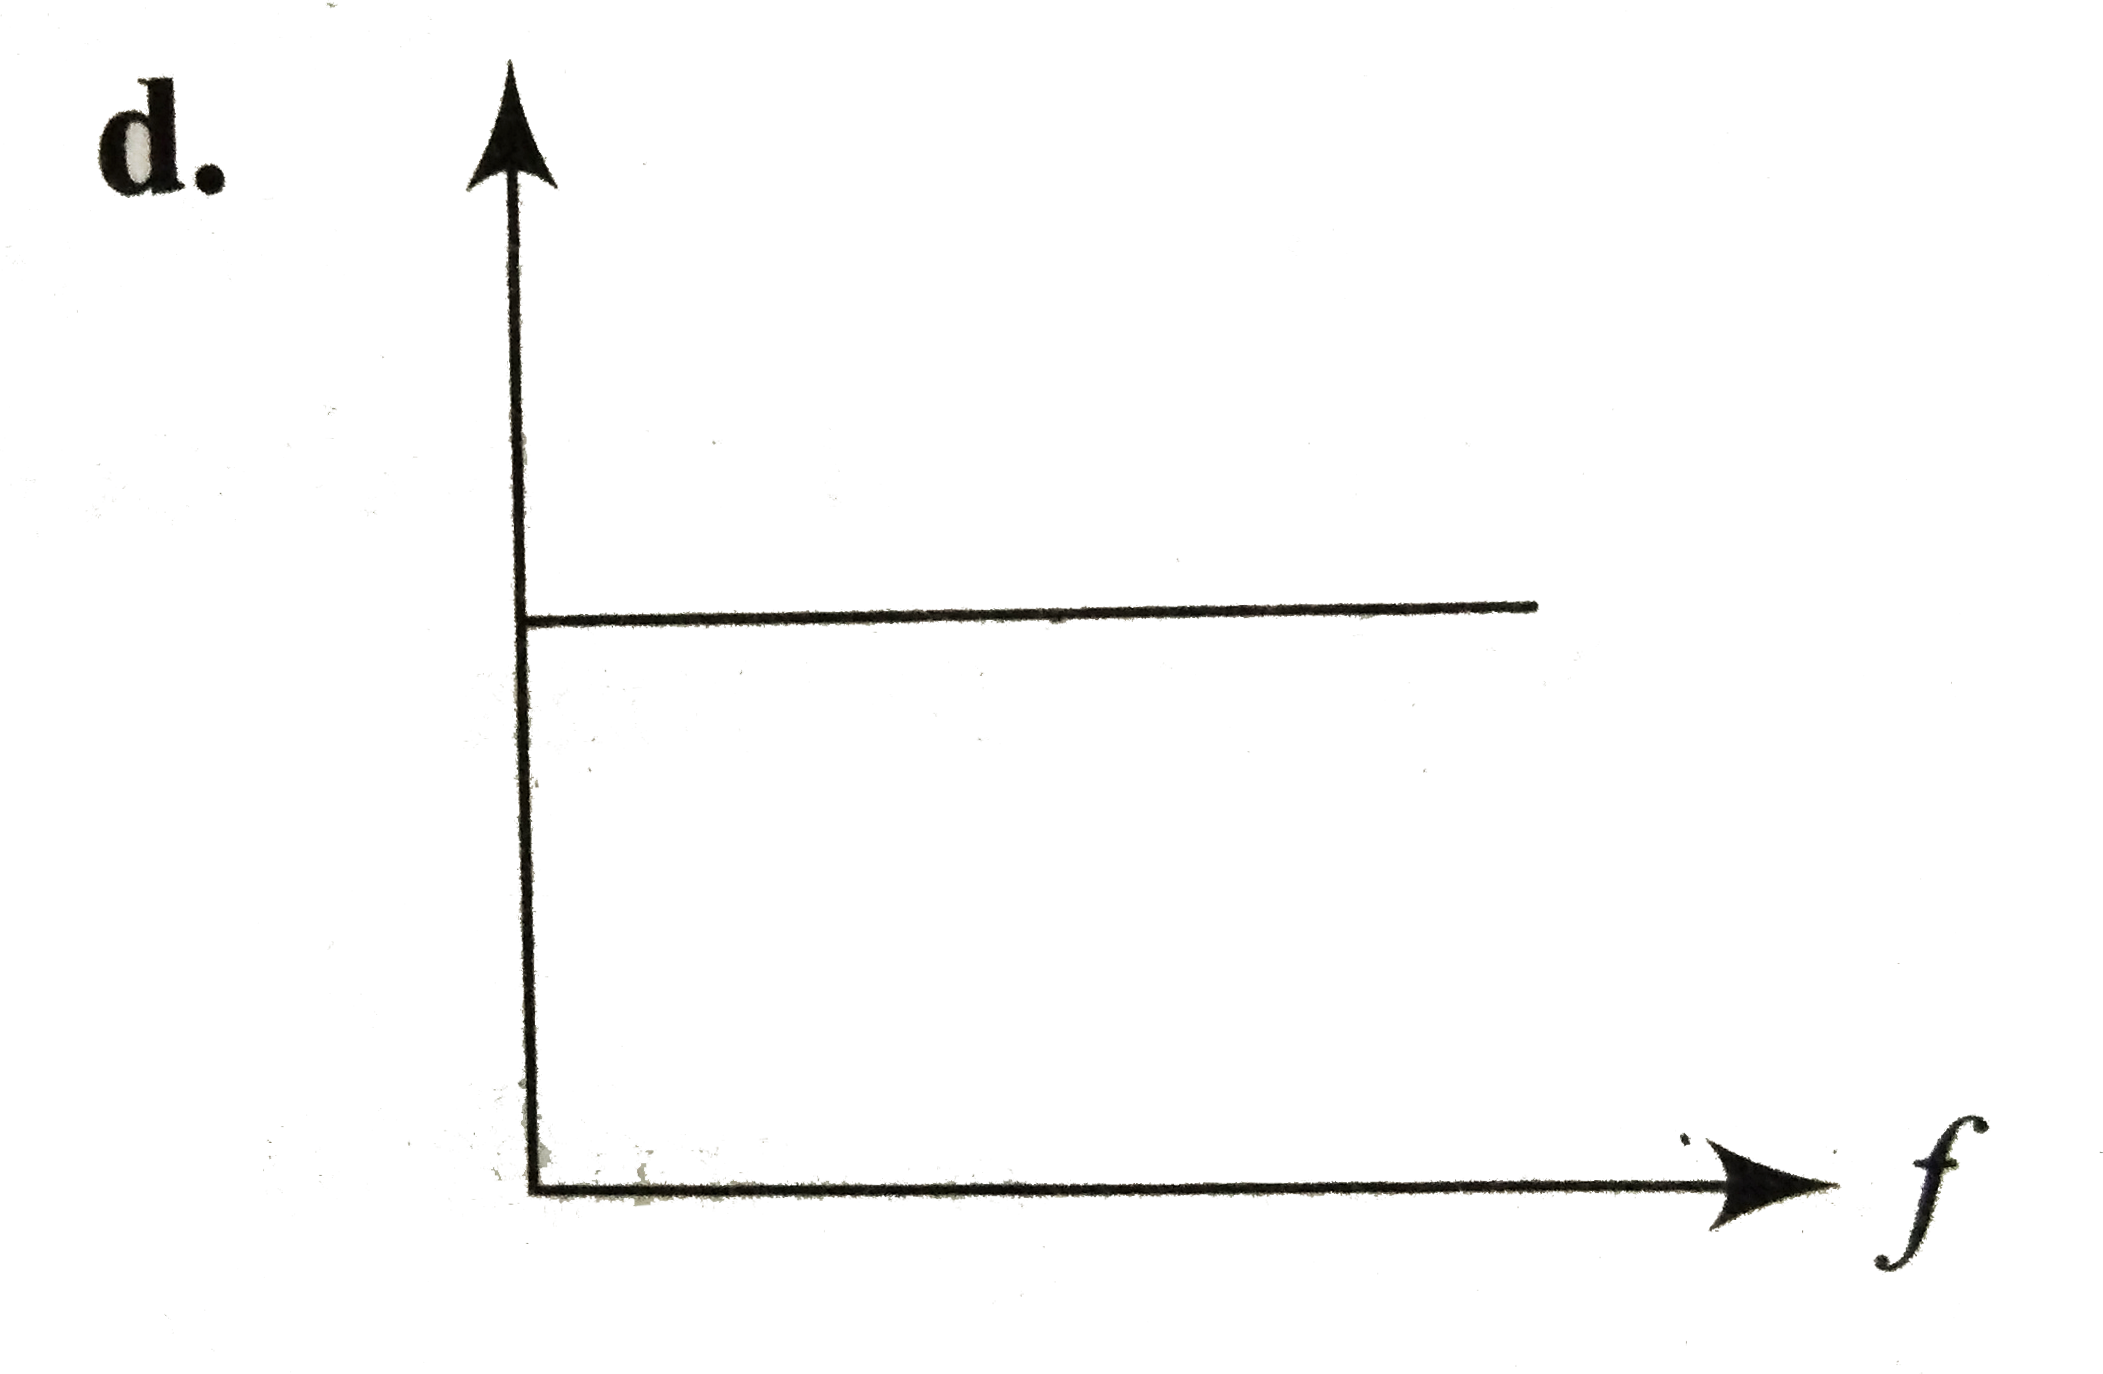
- Which of following graphs correctly represents the variation of partic...
Text Solution
|
- Five volt of stopping potential is needed for the photoelectrons emitt...
Text Solution
|
- The work function for tungsten and sodium are 4.5 eV and 2.3 eV respec...
Text Solution
|