Home
Class 12
PHYSICS
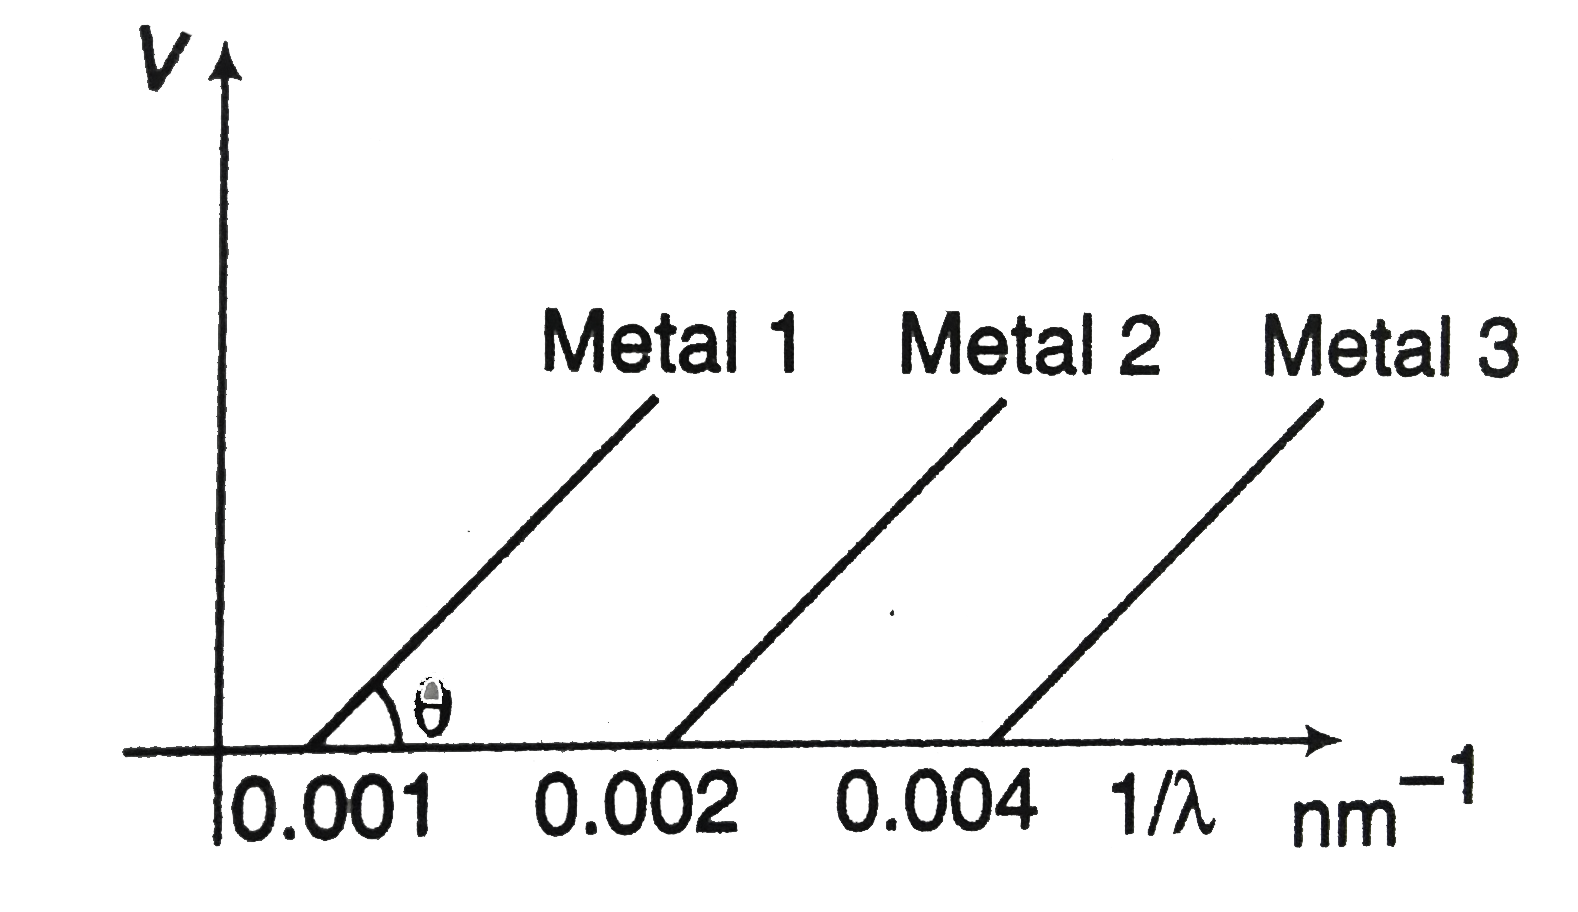
The graph between 1//lambda and stopping...

The graph between `1//lambda` and stopping potential (V) of three metals having work- functions `Phi_1`, `Phi_2` and `Phi_3` in an experiment of photoelectric effect is plotted as shown in the figure. Which of the following statement(s) is/are correct? (Here, `lambda` is the wavelength of the incident ray).

A

`phi_1:phi_2:phi_3=1:2:4`

B

`phi_1:phi_2:phi_3=4:2:1`

C

`tanthetaprop((hc))/(e)`

D

Ultraviolet light can be used to emit photoelectrons from metal 2 and metal 3 only

Text Solution

Verified by Experts

The correct Answer is:
A, C

`phi_a:phi_2:phi_3=eV_(01):eV_(02):eV_(03)`
`V_(01):V_(02):V_(03)=0.001:0.002:0.003=1:2:4`
therefore, option (a) is correct.
By Einstein's photoelectric equation, `(hc)/(lamda)-phi=eV`
`impliesV=(hc)/(elamda)-(phi)/(e)` ..(i)
Comparing Eq. (i) by `y=mx+c`, we get the slope of the line `m=(hc)/(e)=tantheta`
`implies` Option (c ) is correct.
From the graph it is clear that,
`(1)/(lamda_(01))=0.001nm^(-1)`
`implieslamda_(01)=(1)/(0.001)=1000nm`
Also, `(1)/(lamda_(02))=0.002nm^(-1)implieslamda_(02)=500nm`
and `lamda_(03)=250nm`
Violet color light will have wavelength less that 400 nm. Therefore, this light will be unable to show photoelectric effect on plate 3 `implies` Option (d) is wrong.
Promotional Banner

Topper's Solved these Questions

  • PHOTOELECTRIC EFFECT

    CENGAGE PHYSICS ENGLISH|Exercise Linked Comprehension Type|3 Videos
  • PHOTOELECTRIC EFFECT

    CENGAGE PHYSICS ENGLISH|Exercise Integer Type|4 Videos
  • PHOTOELECTRIC EFFECT

    CENGAGE PHYSICS ENGLISH|Exercise Single Correct Answer Type|7 Videos
  • NUCLEAR PHYSICS

    CENGAGE PHYSICS ENGLISH|Exercise ddp.5.5|14 Videos
  • RAY OPTICS

    CENGAGE PHYSICS ENGLISH|Exercise DPP 1.6|12 Videos

Similar Questions

Explore conceptually related problems

The graph between 1/lambda and stopping potential V_(0) of two metals having work funcation phi_(1) and phi_(2) in an experiment of photoelectric effect is obtained as shown in the figure. Find out - (i) Threshold wavelength ofboth metals (ii) phi_(1) : phi_(2) (iii) Whihc metal cen emit photoelectrons with visible light ?

In a photoelectric experiment, kinetic energy of photoelectrons was plotted against the frequency of incident radition (v) , as show in figure. Which of the following statements is correct ?

The graph between the stopping potential (V_(0)) and ((1)/(lambda)) is shown in the figure phi_(1) , phi_(2) and phi_(3) are work function , which of the following is /are correct

The graph between the stopping potential V_(0) and frequency v for two different metal plates P and Q are shown in the figure. Which of the metals has greater threshold wavelength and work function.

If graph of a function f(x) which is defined in [-1, 4] is shown in the following figure then identify the correct statement(s).

Three metals have work functions in the ratio 2 3:4. Graphs are drawn for all connecting stopping potential and incident frequency. The graphs have slopes in the ratio

The work function (phi) of some metals is listed below . The number of metals which will show photoelectric effect when light of 300 nm wavelength falls on the metal is :

If a graph is plotted between 1/v and 1/u , which one of the graph shown in figure is approximately correct ?

In a photoelectric effect experiment, the graph of stopping potential V versus reciprocal of wavelength obtained is shown in the figure. As the intensity of incident radiation is increased :

In an experiment on photoelectric effect the frequency f of the incident light is plotted against the stopping potential V_(0) . The work function of the photoelectric surface is given by ( e is the electronic charge)