Home
Class 11
PHYSICS
The figure shows an instantaneous displa...


The figure shows an instantaneous displacement position graph of a sound wave travelling along the positive x-axis Identify the points of
i.Maximum pressure,
ii. Minimum pressure and
iii. Atmospheric pressure (or normal pressure.)

Text Solution

Verified by Experts


i. Maximum pressure occure at A because air particles are displaced towards it.
ii. Minimum pressure occurs at C because air particles are displaced away fro it.
iii. Pressure remains atmospheric at B.
Promotional Banner

Topper's Solved these Questions

  • SOUND WAVES AND DOPPLER EFFECT

    CENGAGE PHYSICS ENGLISH|Exercise Examples|56 Videos
  • SOUND WAVES AND DOPPLER EFFECT

    CENGAGE PHYSICS ENGLISH|Exercise Exercise 6.1|56 Videos
  • RIGID BODY DYNAMICS 2

    CENGAGE PHYSICS ENGLISH|Exercise Interger|2 Videos
  • SUPERPOSITION AND STANDING WAVES

    CENGAGE PHYSICS ENGLISH|Exercise Comprehension Type|5 Videos

Similar Questions

Explore conceptually related problems

The equation of a wave travelling along the positive x-axis, as shown in figure at t = 0 is given by

the equation of a wave travelling along the positive x - axis ,as shown in figure at t = 0 is given by

Figures (i) and (ii) below show the displacement - time graphs of two particles moving along the x-axis. We can say that

The position of a transverse wave travelling in medium along positive x-axis is shown in figure at time t=0. Speed of wave is v=200 m/s Frequency of the wave is

Figure below shows the distance-displacement graph of two waves A and B. Compare (i) the amplitude, (ii) the wavelength of the two waves.

The position of a transverse wave travelling in medium along positive x-axis is shown in figure at time t=0. Speed of wave is v=200 m/s Equation of the wave is (in SI unit)

A rectangular container moves with an acceleration a along the positive direction as shown in figure. The pressure at the A in excess of the atmospheric pressure p_(0) is (take rho as the density of liquid)

The sketch in the figure shows displacement time curve of a sinusoidal wave at x = 8m . Taking velocity of wave v = 6m//s along positive x- axis, write the equation the wave.

The figure represents the instantaneous picture of a transverse harmonic wave traveling along the negative x-axis. Choose the correct alternative(s) related to the movement of the nine points shown in the figure. The points moving downwards is

The displacement vs time graph for two waves A and B which travel along the same string arre shown in the figure. Their intensity ratio I_(A)|I_(B) is

CENGAGE PHYSICS ENGLISH-SOUND WAVES AND DOPPLER EFFECT-Integer
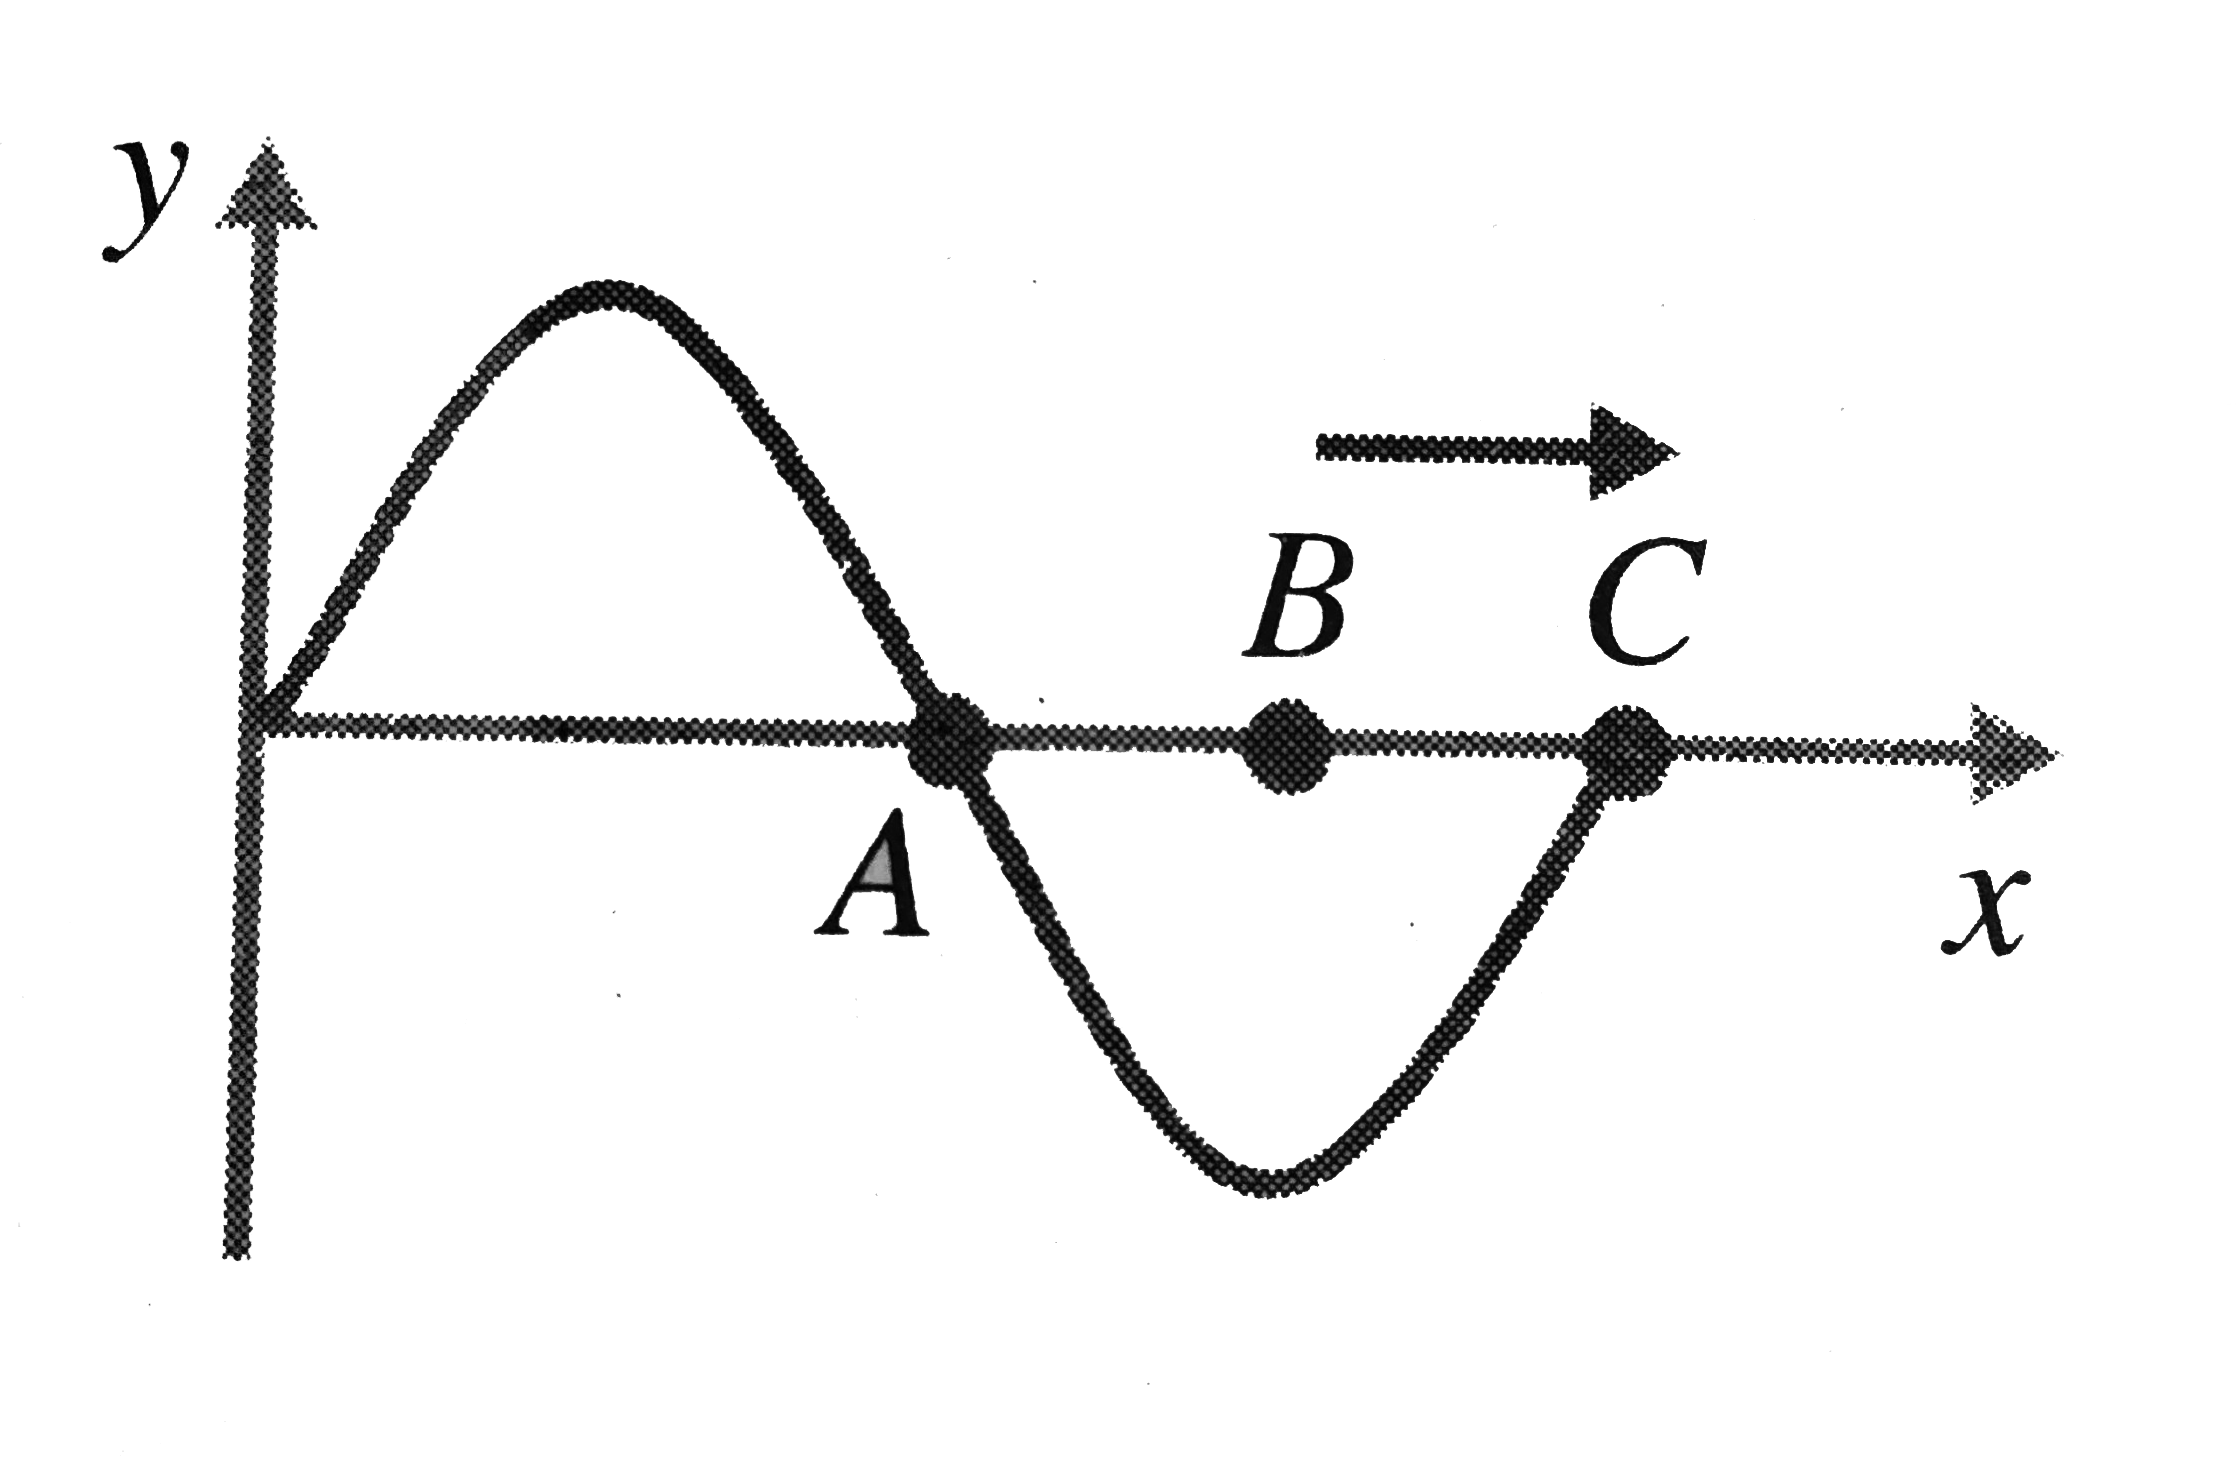
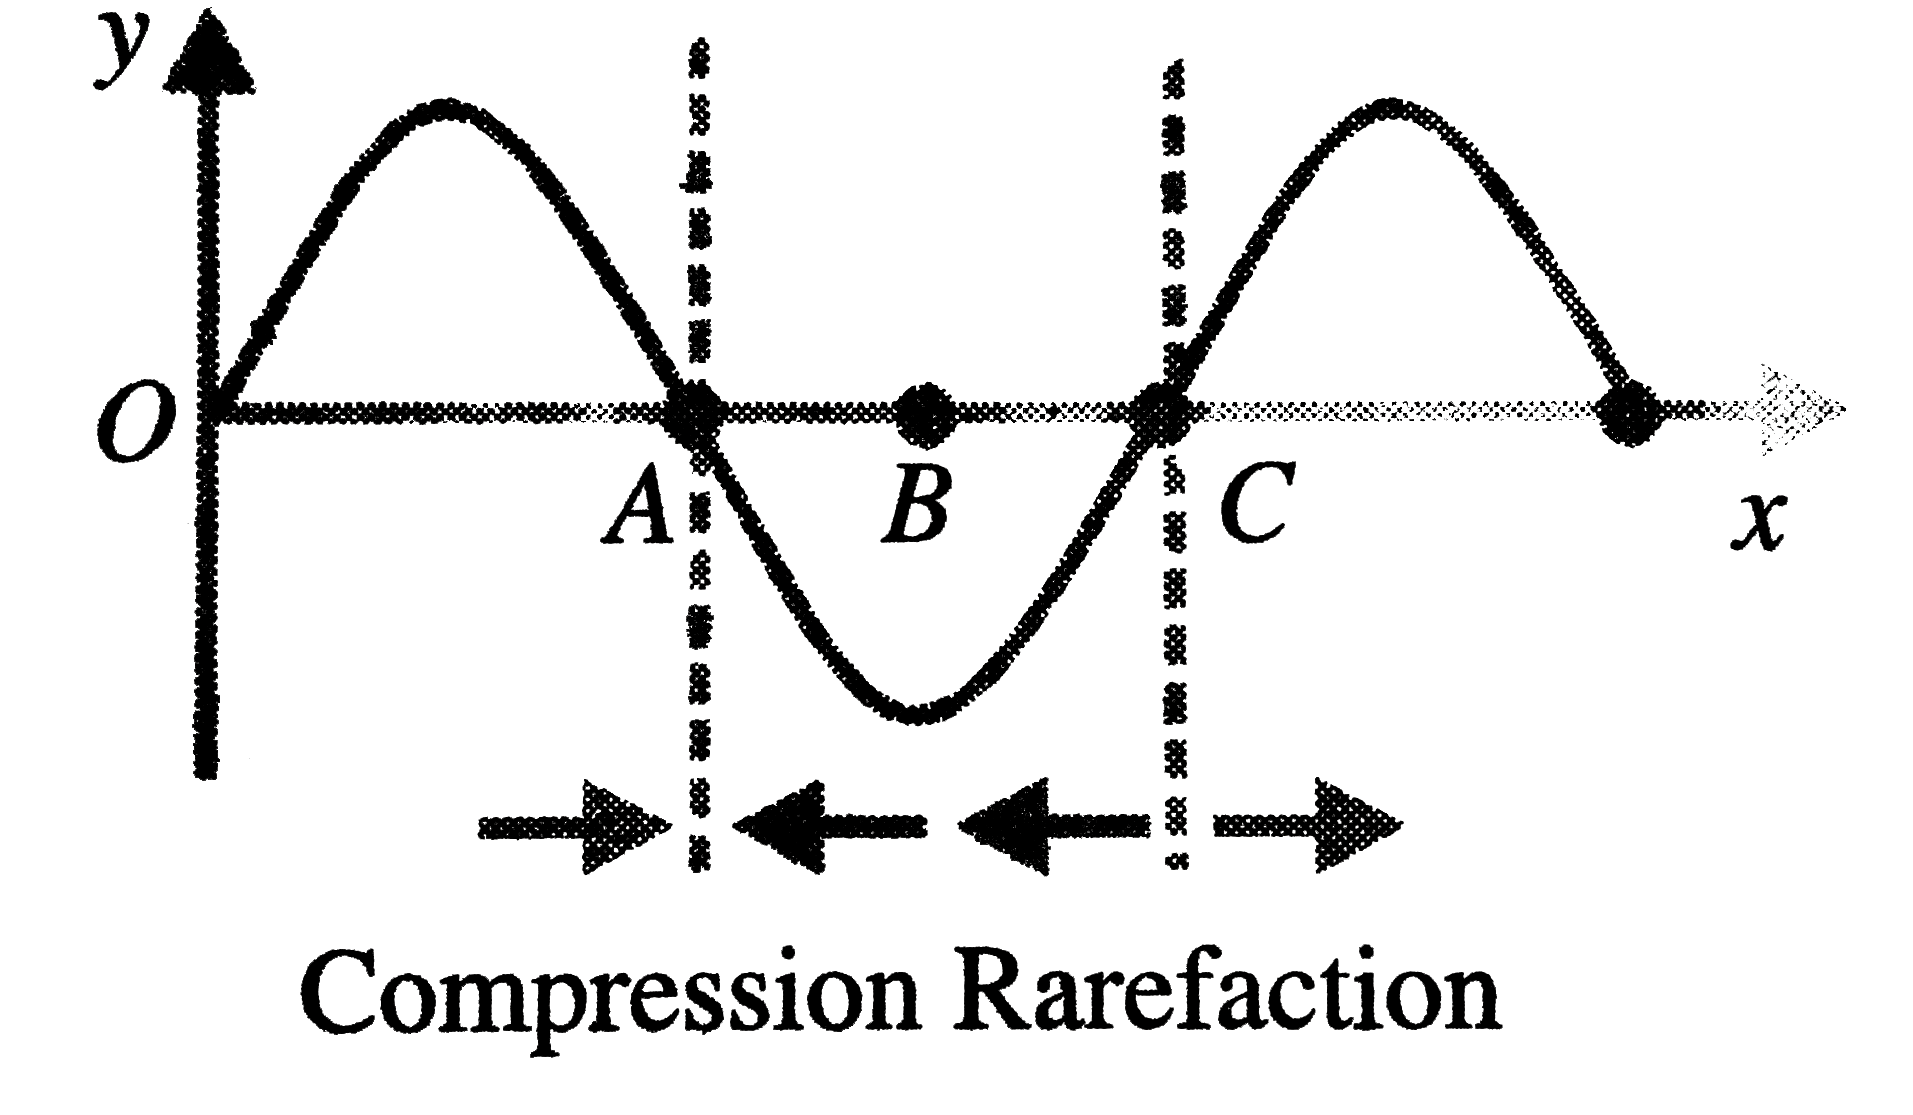
  1. The figure shows an instantaneous displacement position graph of a sou...

    Text Solution

    |

  2. The average power transmitted across a cross section by two sound wave...

    Text Solution

    |

  3. Loudness of sound from an isotropic point source at a distace of 70cm ...

    Text Solution

    |

  4. Two sound sources are moving away from a stationary observer in opposi...

    Text Solution

    |

  5. The resultant loudness at a point P is n dB higher than the loudness o...

    Text Solution

    |

  6. The average power transmitted across a cross section by two sound wave...

    Text Solution

    |

  7. Loudness of sound from an isotropic point source at a distace of 70cm ...

    Text Solution

    |

  8. Two sound sources are moving away from a stationary observer in opposi...

    Text Solution

    |

  9. The resultant loudness at a point P is n dB higher than the loudness o...

    Text Solution

    |

  10. The average power transmitted across a cross section by two sound wave...

    Text Solution

    |

  11. Loudness of sound from an isotropic point source at a distace of 70cm ...

    Text Solution

    |

  12. Two sound sources are moving away from a stationary observer in opposi...

    Text Solution

    |

  13. The resultant loudness at a point P is n dB higher than the loudness o...

    Text Solution

    |

  14. The average power transmitted across a cross section by two sound wave...

    Text Solution

    |

  15. Loudness of sound from an isotropic point source at a distace of 70cm ...

    Text Solution

    |

  16. Two sound sources are moving away from a stationary observer in opposi...

    Text Solution

    |

  17. The resultant loudness at a point P is n dB higher than the loudness o...

    Text Solution

    |