Text Solution
Verified by Experts


Topper's Solved these Questions
KINETIC THEORY OF GASES AND FIRST LAW OF THERMODYNAMICS
CENGAGE PHYSICS ENGLISH|Exercise Solved Examples|14 VideosKINETIC THEORY OF GASES AND FIRST LAW OF THERMODYNAMICS
CENGAGE PHYSICS ENGLISH|Exercise Exercise 2.1|20 VideosKINETIC THEORY OF GASES
CENGAGE PHYSICS ENGLISH|Exercise Compression|2 VideosLINEAR AND ANGULAR SIMPLE HARMONIC MOTION
CENGAGE PHYSICS ENGLISH|Exercise Single correct anwer type|14 Videos
Similar Questions
Explore conceptually related problems
CENGAGE PHYSICS ENGLISH-KINETIC THEORY OF GASES AND FIRST LAW OF THERMODYNAMICS-Interger
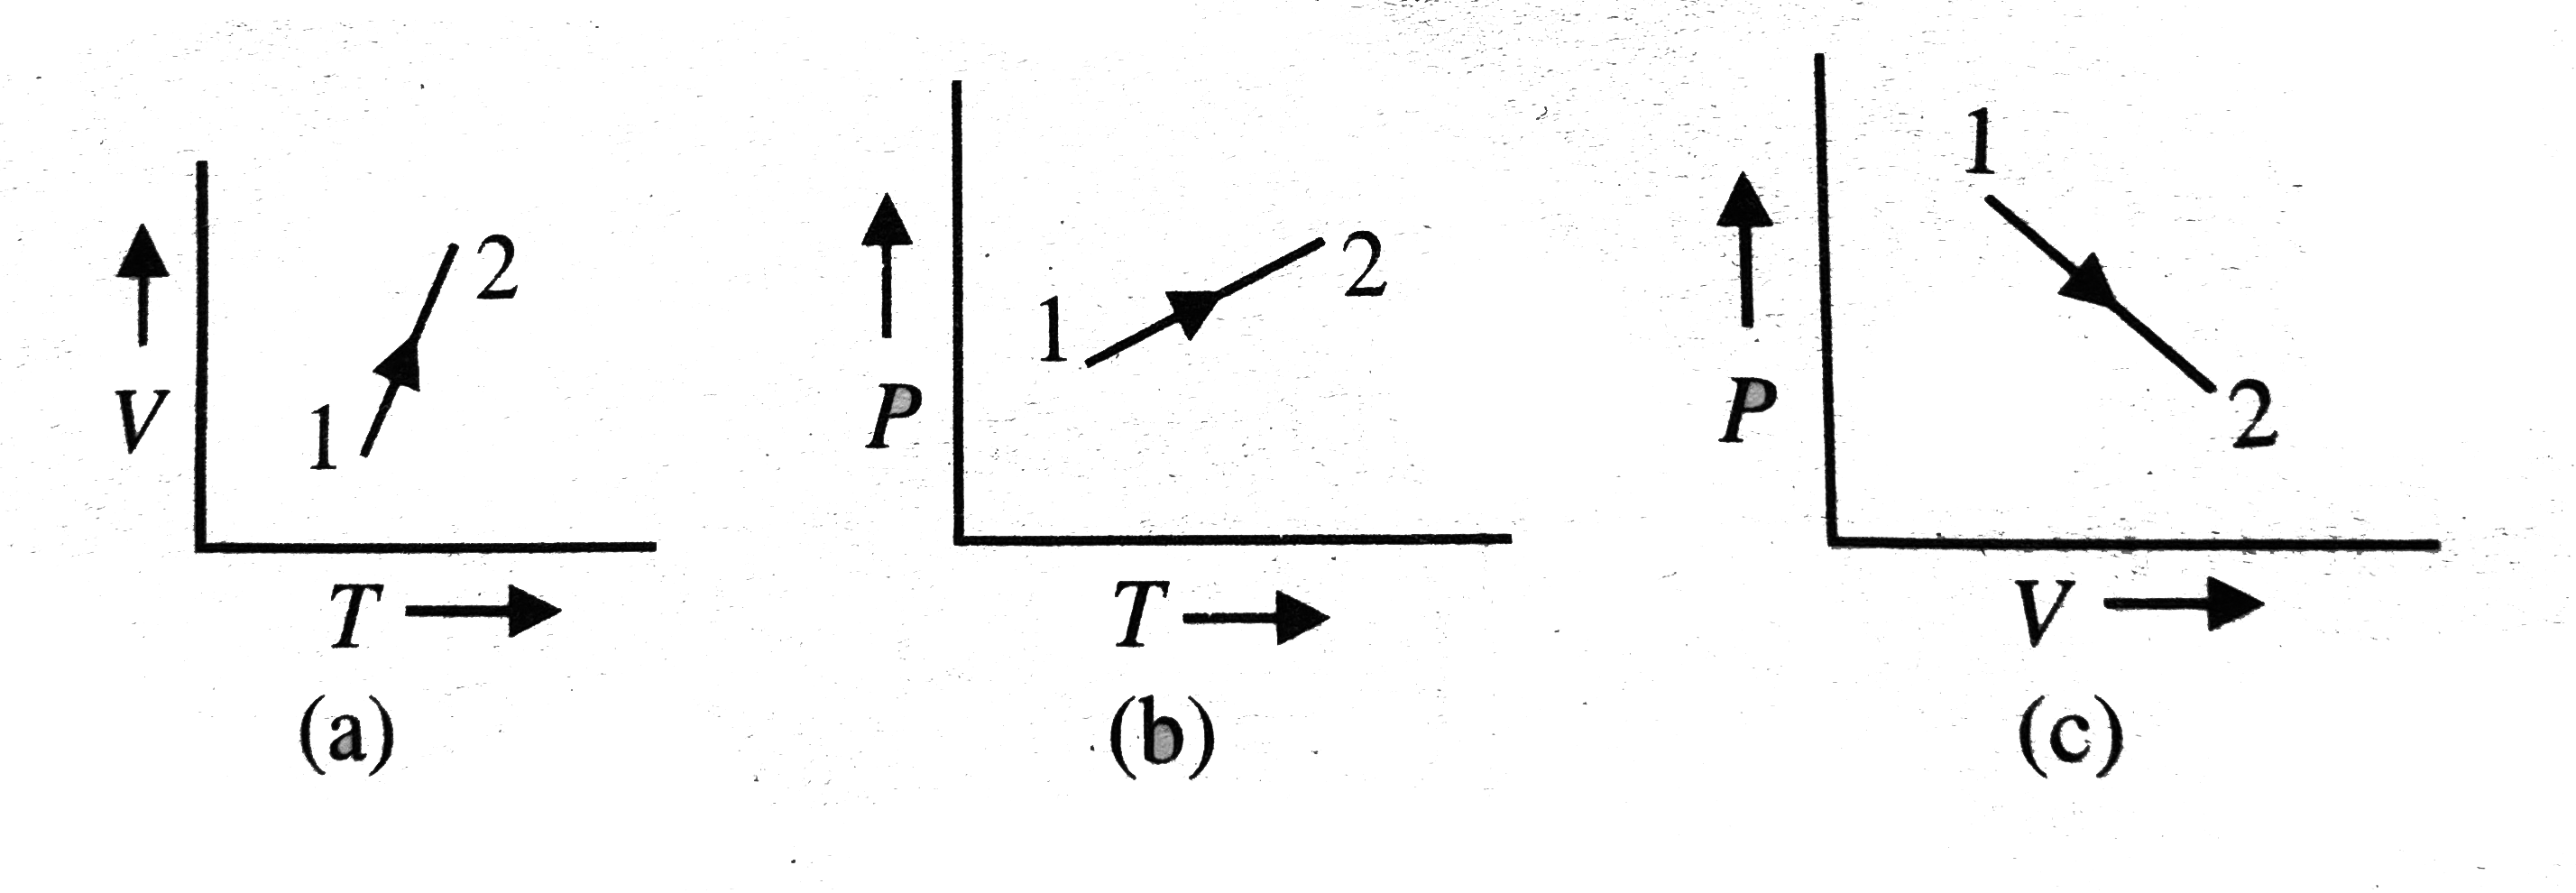
- The three diagrams below depict three different processes for a given ...
Text Solution
|
- 8g of oxygen, 14 g of nitrogen and 22 g carbon dioxide are mixed in an...
Text Solution
|
- A vessel contains 1 mole of O(2) gas (molar mass 32) at a temperature ...
Text Solution
|
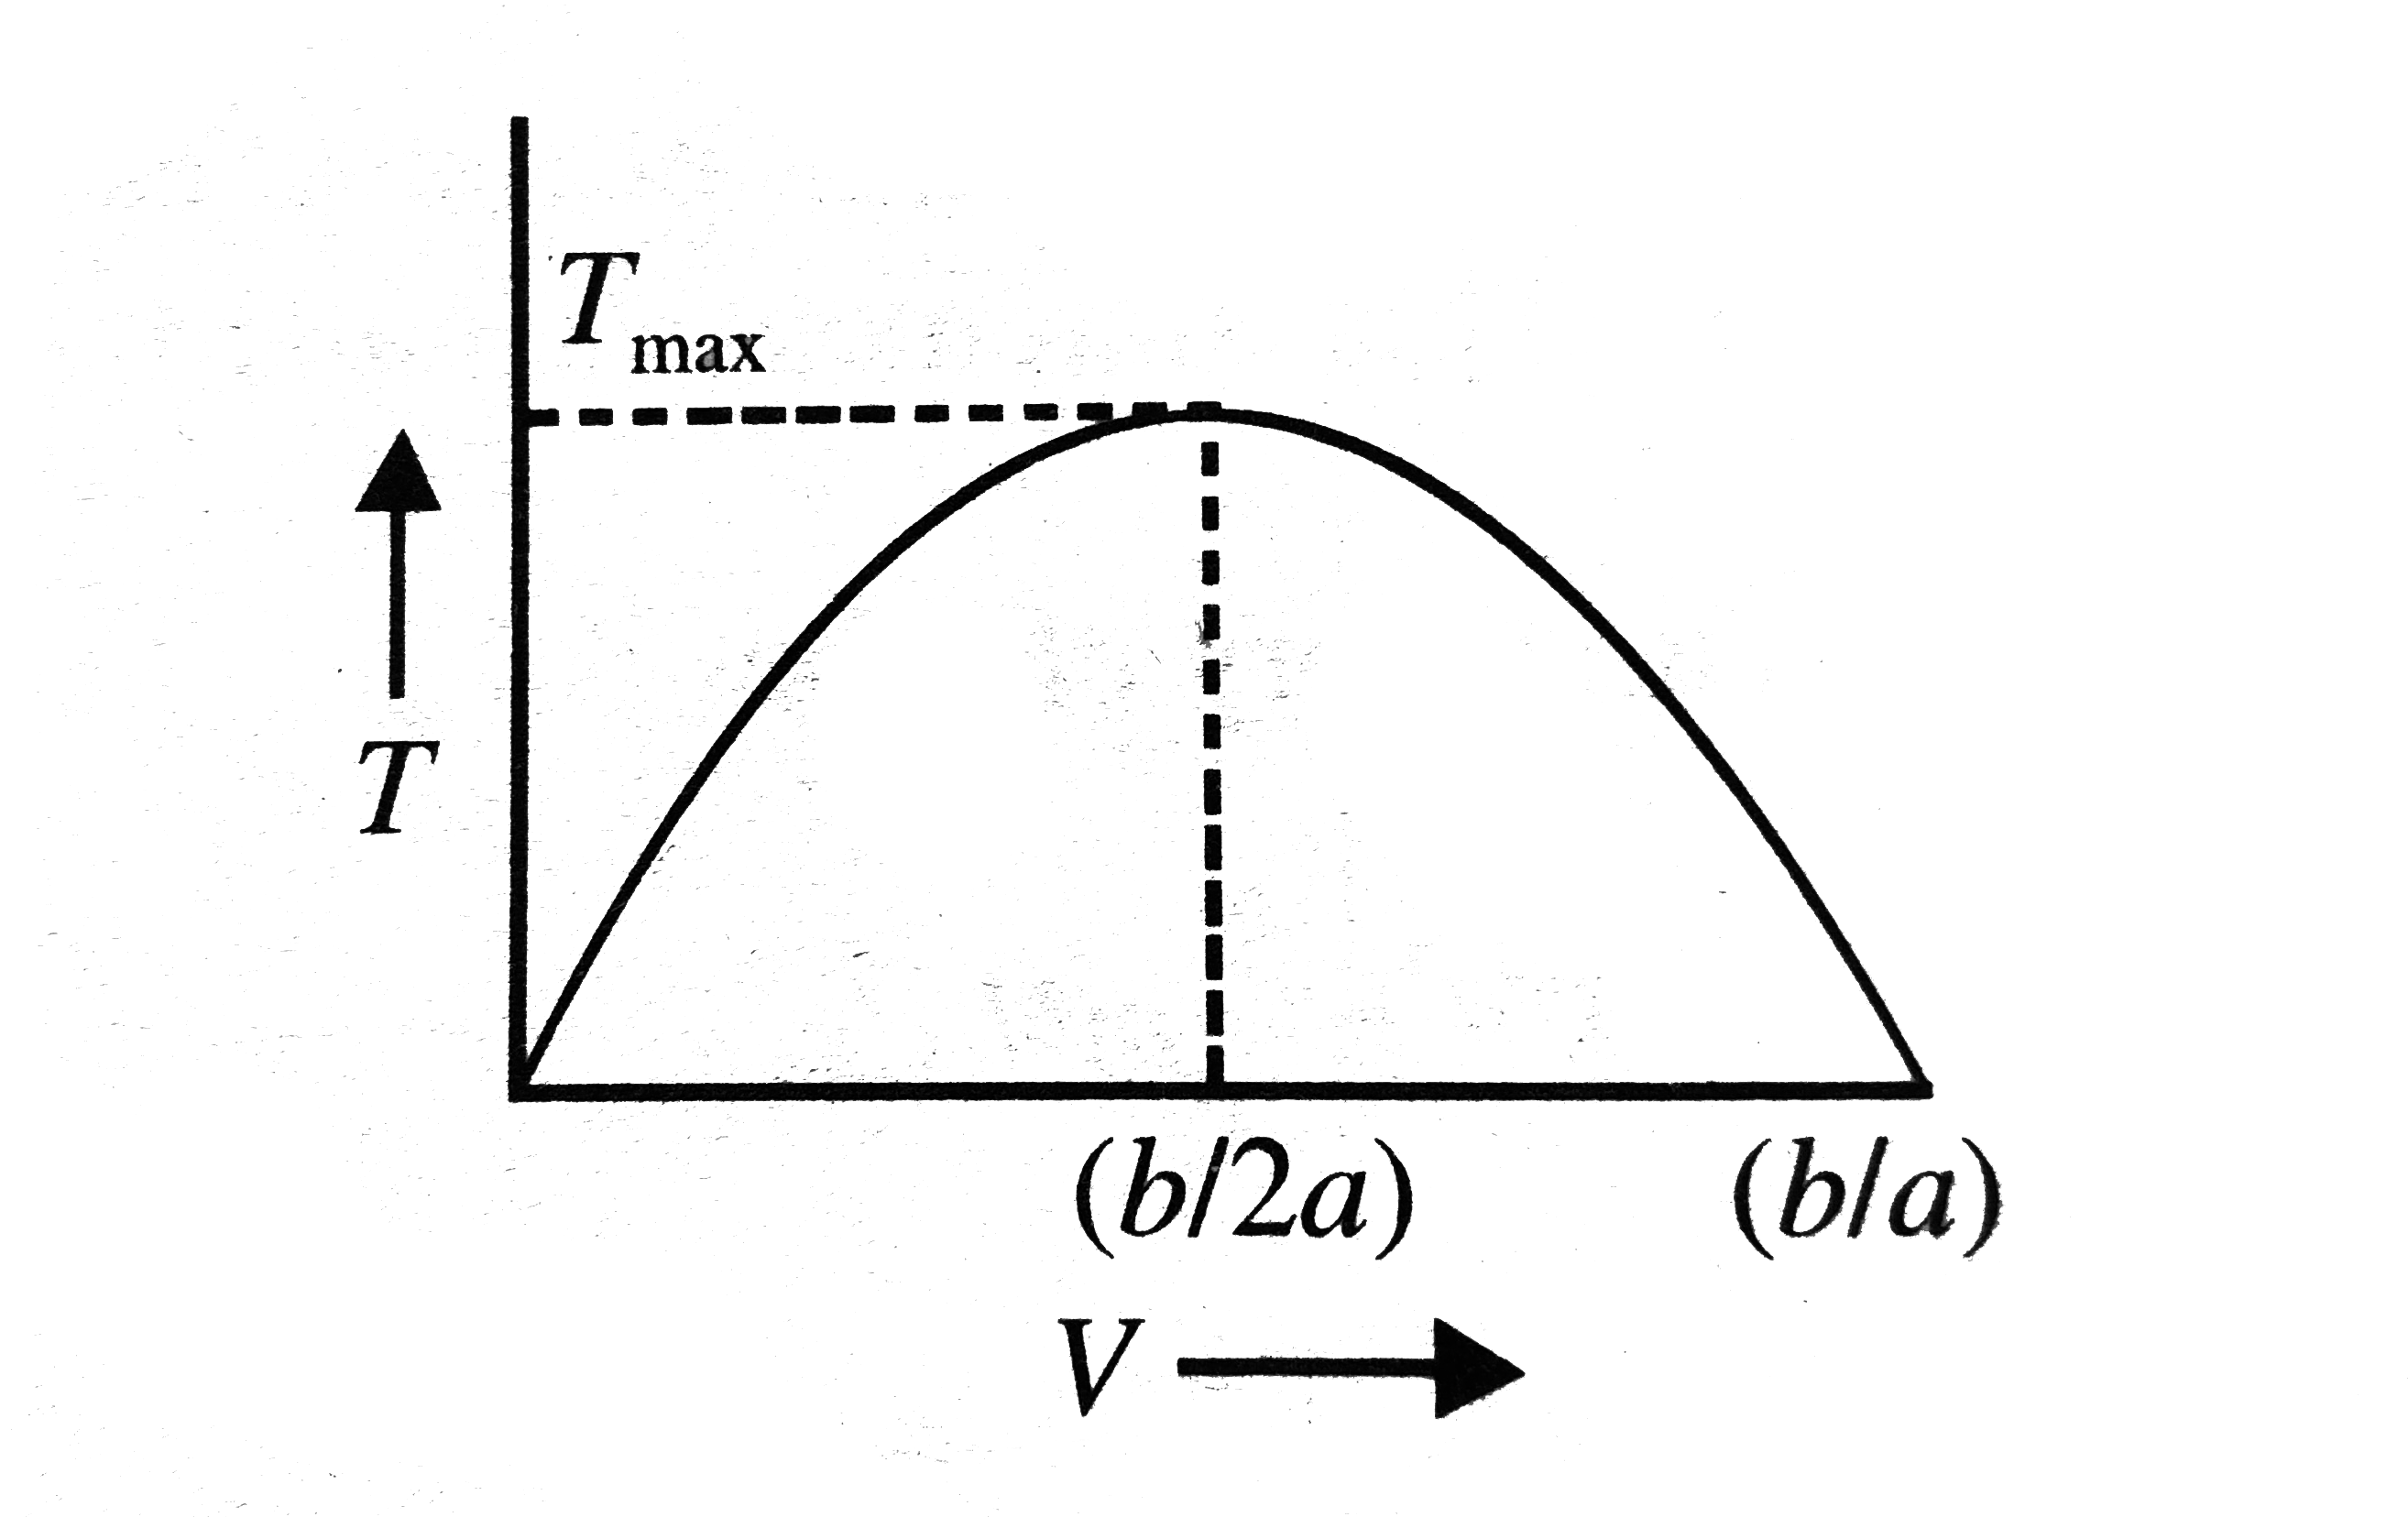
- p-V diagram of a diatomic gas is a straight line passing through origi...
Text Solution
|
- A vessel contains a mixture of one mole of oxygen and two moles of nit...
Text Solution
|
- A vessel A of volume 3V contains a gas at pressure 4p(0) and a vessel ...
Text Solution
|
- A vessel of volume 0.2 m^(3) contains hydrogen gas at temperature 300 ...
Text Solution
|
- A Vessel contains helium, which expands at constant pressure when 15 k...
Text Solution
|
- A certain mass of gas is taken from an initial thermodynamics state A ...
Text Solution
|
- The two conducting cyliner-piston systems shows below are linked. Cyli...
Text Solution
|
- A long container has air enclosed inside at room temperature and atmos...
Text Solution
|
- The value of gamma = C(P)//C(V) is 4//3 for an adaibatic process of an...
Text Solution
|