A
B
C
D
Text Solution
Verified by Experts
The correct Answer is:


Topper's Solved these Questions
MOTION IN STRAIGHT LINE
AAKASH INSTITUTE ENGLISH|Exercise Assignment (SECTION - E)|8 VideosMOTION IN STRAIGHT LINE
AAKASH INSTITUTE ENGLISH|Exercise Assignment (SECTION - F)|2 VideosMOTION IN STRAIGHT LINE
AAKASH INSTITUTE ENGLISH|Exercise Assignment (SECTION - C)|7 VideosMOTION IN A STRAIGHT LINE
AAKASH INSTITUTE ENGLISH|Exercise ASSIGNMENT (SECTION - D)|15 VideosMOVING CHARGE AND MAGNESIUM
AAKASH INSTITUTE ENGLISH|Exercise SECTION D|16 Videos
Similar Questions
Explore conceptually related problems
AAKASH INSTITUTE ENGLISH-MOTION IN STRAIGHT LINE-Assignment (SECTION - D)
- Graphs are very useful to represent a physical situation. Various quan...
Text Solution
|
- Graphs are very useful to represent a physical situation. Various quan...
Text Solution
|
- Graphs are very useful to represent a physical situation. Various quan...
Text Solution
|
- A car starts moving on a straight road. It makes the entire journey in...
Text Solution
|
- A car starts moving on a straight road. It makes the entire journey in...
Text Solution
|
- A car starts moving on a straight road. It makes the entire journey in...
Text Solution
|
- A rocket is fired upwards such that its engine takes 10 s to explods f...
Text Solution
|
- A rocket is fired upwards such that its engine takes 10 s to explods f...
Text Solution
|
- A rocket is fired upwards such that its engine takes 10 s to explods f...
Text Solution
|
- A car accelerates from rest at constant rate of 2ms^(-2) for some time...
Text Solution
|
- A car accelerates from rest at constant rate of 2ms^(-2) for some time...
Text Solution
|
- A car accelerates from rest at constant rate of 2ms^(-2) for some time...
Text Solution
|
- A car acceleration from rest at a constant rate 2m//s^(2) for some tim...
Text Solution
|
- A car accelerates from rest at constant rate of 2ms^(-2) for some time...
Text Solution
|
- A car accelerates from rest at constant rate of 2ms^(-2) for some time...
Text Solution
|
- A car accelerates from rest at constant rate of 2ms^(-2) for some time...
Text Solution
|
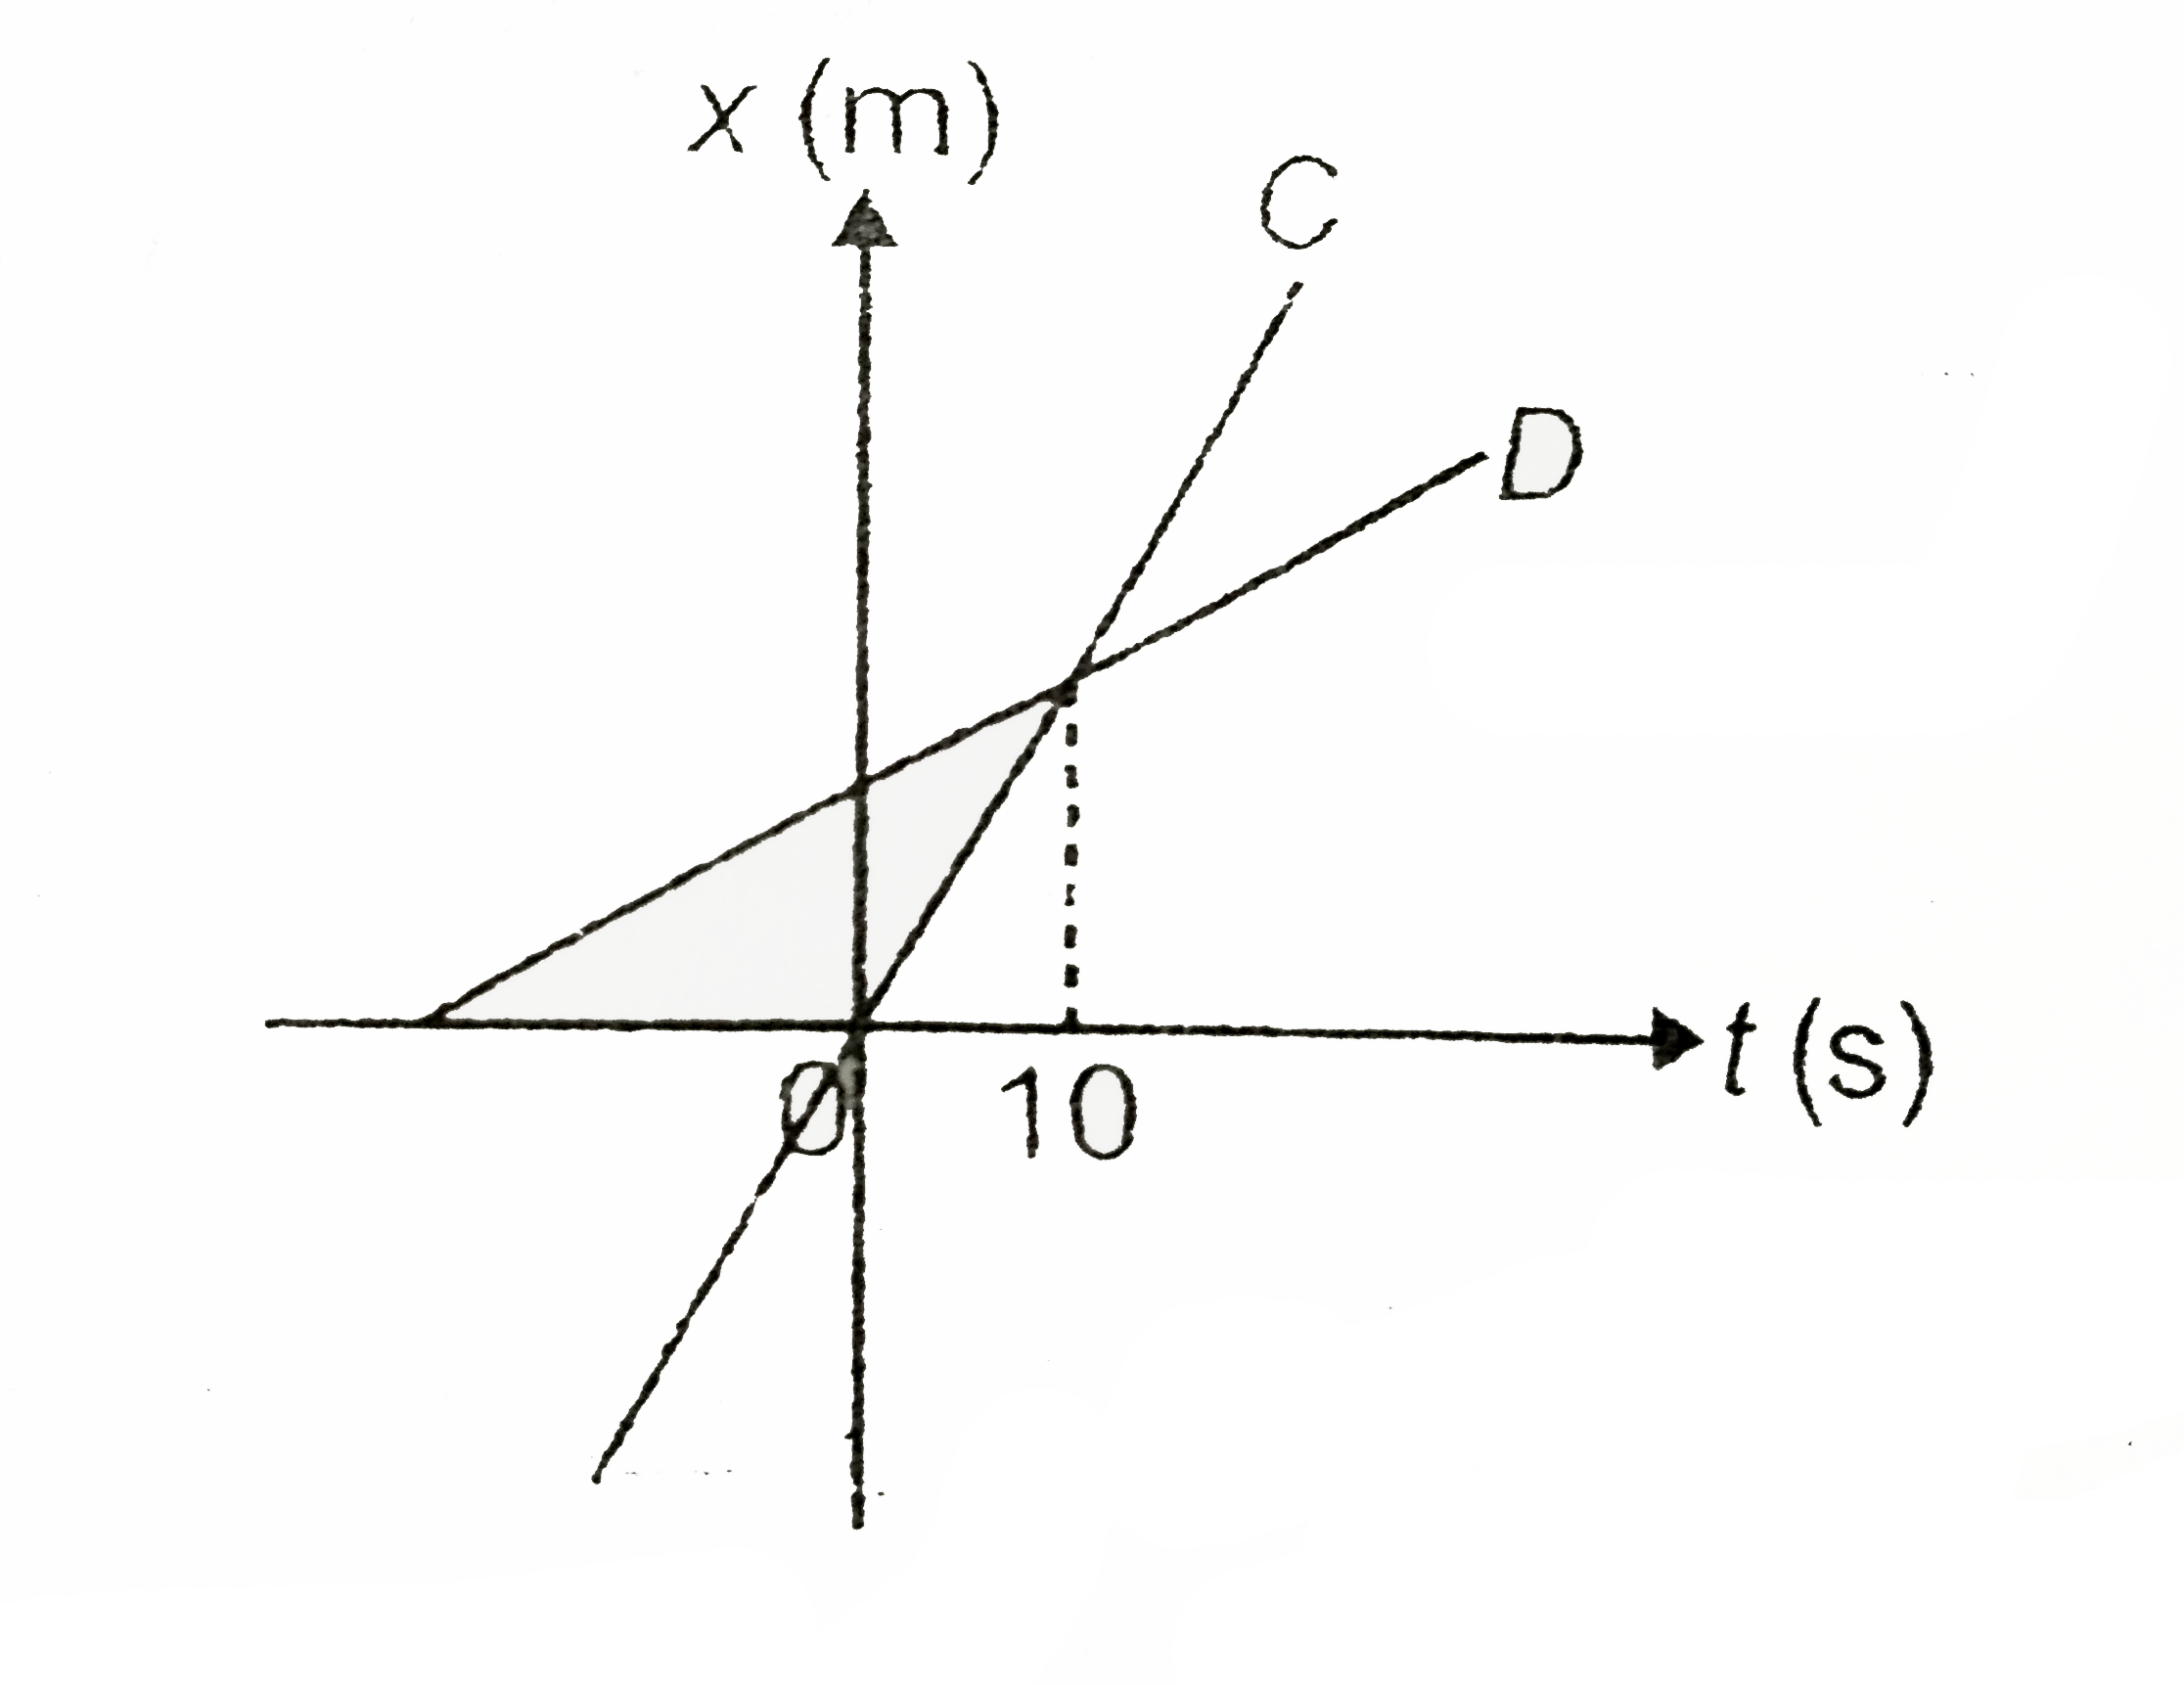
- The figure shows position time graph of two riders C and D. Based on t...
Text Solution
|
- The figure shows position time graph of two riders C and D. Based on t...
Text Solution
|
- The figure shows position time graph of two riders C and D. Based on t...
Text Solution
|
- The figure shows position time graph of two riders C and D. Based on t...
Text Solution
|