A

B

C

D

Text Solution
Verified by Experts
The correct Answer is:


Topper's Solved these Questions
KINETIC THEORY
AAKASH INSTITUTE ENGLISH|Exercise Assignment (Section-C) Objective type questions (More than one option are correct)|9 VideosKINETIC THEORY
AAKASH INSTITUTE ENGLISH|Exercise Assignment (Section-D) (Linked Comprehension Type Questions)|6 VideosKINETIC THEORY
AAKASH INSTITUTE ENGLISH|Exercise Assignment (Section-A) Objective type questions (One option is correct)|49 VideosGRAVITATION
AAKASH INSTITUTE ENGLISH|Exercise ASSIGNMENT SECTION - D (ASSERTION-REASON TYPE QUESTIONS)|15 VideosLAWS OF MOTION
AAKASH INSTITUTE ENGLISH|Exercise Assignment (SECTION-D) (Assertion-Reason Type Questions)|15 Videos
Similar Questions
Explore conceptually related problems
AAKASH INSTITUTE ENGLISH-KINETIC THEORY-Assignment (Section-B) Objective type questions (One option is correct)
- In a process, the pressure of a gas remains constant. If the temperatu...
Text Solution
|
- The temperature of an ideal gas is increased from 27 ^@ C to 927^(@)C....
Text Solution
|
- A gas is found to obey the law p^(2)V=constant. The initial temperatur...
Text Solution
|
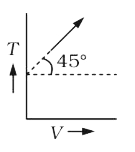
- The given curve represents the variation of temperature as a function ...
Text Solution
|
- Two closed vessels A,B are at the same temperature T and contain gases...
Text Solution
|
- A vessel contains 28 g of N(2) and 32 g of O(2) at temperature T = 180...
Text Solution
|
- A container of volume 1m^3 is divided into two equal parts by a parti...
Text Solution
|
- If a gas of a volume V(1) at pressure p(1) is compressed adiabatically...
Text Solution
|
- Find the average momentum of molecules of hydrogen gas in a container ...
Text Solution
|
- If 2 mol of an ideal monatomic gas at temperature T(0) are mixed with ...
Text Solution
|