Home
Class 10
PHYSICS
A piece of ice is heated at a constant r...

A piece of ice is heated at a constant rate. The variation in temperature with time of heating is shown in the graph in Fig. 11.6.
(i) What is represented by the part AB ?
(ii) What does the part CD represent ?
(iii) What conclusion do you draw regarding the nature of ice from the graph ?

Text Solution

Verified by Experts


(i) The part AB represents melting of ice at `0^@`C.
(ii) The part CD represents boiling of water at `100^@`C.
(iii) The ice initially is in solid state at `-10^@`C. On heating, its temperature rises to `0^@`C. It then takes some heat energy at `0^@`C to melt in water at `0^@`C which is called its latent heat.
Promotional Banner

Topper's Solved these Questions

  • CALORIMETRY

    ICSE|Exercise EXERCISE-11(A)|30 Videos
  • CALORIMETRY

    ICSE|Exercise EXERCISE-11(A) (MULTIPLE CHOICE TYPE)|3 Videos
  • WORK ENERGY AND POWER

    ICSE|Exercise EXERCISE-2(C ) NUMERICALS|6 Videos
  • CURRENT ELECTRICITY

    ICSE|Exercise EXERCISE-8(C) NUMERICALS |35 Videos

Similar Questions

Explore conceptually related problems

A solid material is supplied heat at a constant rate. The temperature of material is changing with heat input as shown in the figure. What does the slope of DE represent ?

A solid material is supplied with heat at a constant rate. The temperature of the material is changing with the heat input as shown in the graph in figure. Study the graph carefully and answer the following questions: (i) What do the horizontal regions AB and CD represent? (ii) If CD is equal to 2AB, what do you infer? (iii) What does the slope of DE represents? (iv) The slope of OAgtthe slope of BC . What does this indicate?

A certain mass of ice at 0^@C is converted to steam at 100^@C by constant heating, Draw temperature-time graph showing the change in phases.

1 kg of ice at 0^@ C is heated at a constant rate and its temperature is recorded after every 30 s till steam is formed at 100^@ C. Draw a temperature-time graph to represent the change of phases.

A piece of ice at 0^(@)C is heated at a constant rate and its temperature recorded at regular intervals till steam is formed at 100^(@)C . Draw a temperature-time graph to represent the change in phase. Label the different parts of your graph.

A substance initially in solid state at 0^@ C is heated. The graph showing the variation in temperature with the amount of heat supplied is shown in Fig. 11.7. If the specific heat capacity of the solid substance is 500 J kg^(-1)^@C^(-1) , use graph to find : (i) the mass of the substance, and (ii) the specific latent heat of fusion of the substance in the liquid state.

Liquid oxygen at 50 K is heated to 300 K at constant pressure of 1 atm . The rate of heating is constant. Which of the following graphs represents the variation of temperature with time?

(i) Name the type of a diode whose characteristics are shown in figure (a) and (b) (ii) What does the point P in fig. (a) represent ? (iii) What does the point P and Q in fig. (b) represent ?

As a physicist, you put heat into a 500 g solid sample at the rate of 10.0 kJ//min , while recording its temperature as a function of time. You plot your data and obtain the graph shown in figure. . (a) What is the latent heat of fusion for this solid? (b) What is the specific heat of solid state of the material?

ICSE-CALORIMETRY-EXERCISE-11(B) (NUMERICALS)
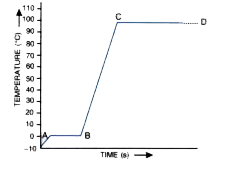
  1. A piece of ice is heated at a constant rate. The variation in temperat...

    Text Solution

    |

  2. 10 g of ice at 0°C absorbs 5460 J of heat energy to melt and change to...

    Text Solution

    |

  3. How much heat energy is released when 5.0 g of water at 20^@C changes ...

    Text Solution

    |

  4. A molten metal of mass 150 g is kept at its melting point 800^@C. When...

    Text Solution

    |

  5. A solid metal weighing 150 g melts at its melting point of 800^(@)C by...

    Text Solution

    |

  6. A refrigerator converts 100 g of water at 20^@C to ice at - 10^@C in 7...

    Text Solution

    |

  7. In an experiment, 17 g of ice is used to bring down the temperature of...

    Text Solution

    |

  8. The temperature of 170 g of water at 50^@C is lowered to 5^@C by addin...

    Text Solution

    |

  9. Find the result of mixing 10 g of ice at -10^@C with 10 g of water at ...

    Text Solution

    |

  10. A piece of ice of mass 40 g is added to 200 g of water at 50^@C. Calcu...

    Text Solution

    |

  11. Calculate the mass of ice needed to cool 150 g of water contained in a...

    Text Solution

    |

  12. 250 g of water at 30^(@)C is present in a copper vessel of mass 50 g. ...

    Text Solution

    |

  13. How much boiling water at 100^@C is needed to melt 2 kg of ice so that...

    Text Solution

    |

  14. Calculate the total amount of heat energy required to convert 100 g of...

    Text Solution

    |

  15. The amount of heat energy required to convert 1 kg of ice at -10^@C to...

    Text Solution

    |

  16. 200 g of ice at 0^@C converts into water at 0^@C in 1 minute when heat...

    Text Solution

    |