Home
Class 10
MATHS
(Use a graph paper for this question). T...

(Use a graph paper for this question). The daily pocket expenses of 200 students in a school are given below:

Draw a histogram representing the above distribution and estimate the mode from the graph.

Text Solution

Verified by Experts

The correct Answer is:
21.5
Promotional Banner

Topper's Solved these Questions

  • MEASURES OF CENTRAL TENDENCY (MEAN, MEDIAN, QUARTILES AND MODE)

    ICSE|Exercise EXERCISE 24 (D)|8 Videos
  • MATRICES

    ICSE|Exercise Exercise 9D|25 Videos
  • MIXED PRACTICE

    ICSE|Exercise SET B|52 Videos

Similar Questions

Explore conceptually related problems

The daily pocket expenses of 200 students in a school are given below : (Use a graph apper for this question.) Draw a histogram representing the above distribution and estimate the mode from the graph.

The daily pocket expenses of 206 students in a school are given below. Construct a frequency polygon representing the above data.

Draw a histogram for the following frequency distribution and find the mode from the graph :

Draw a Histogram for the data, using a graph paper: Estimate the mode from the graph.

Use graph paper for this question. The marks obtained by 120 students in an English test are given below : Draw the ogive and hence, estimate : the median marks.

Use graph paper for this question. The amrks obtained by 120 students in an English test are given below : Draw the ogive and hence, estimate : the upper quartile marks.

In a class of 40 students, the marks obtained (out of 50) are as given below: Draw a histogram to represent the given data.

Use graph paper for this question. The amrks obtained by 120 students in an English test are given below : Draw the ogive and hence, estimate : the number of students who did not pass test if the pass percetage was 50.

The marks obtained (out of 100) by a class of 80 students are given below: Construct a histogram to represent the data above

A mathematics aptitude test of 50 students was recorded as follows : Draw a histogram for the above data using a graph paper and locate the mode.

ICSE-MEASURES OF CENTRAL TENDENCY (MEAN, MEDIAN, QUARTILES AND MODE)-EXERCISE 24 (E)
  1. In a malaria epidemic, the number of cases diagnosed were as follows: ...

    Text Solution

    |

  2. In the given figure, XY || QR, PQ/XQ=7/3 and PR = 6.3 cm, find YR

    Text Solution

    |

  3. The marks of 20 students in a test were as follows, 2,6,8,9,10,11,11...

    Text Solution

    |

  4. If PQR is an equilateral triangle and PX ⊥ QR, find the value of PX^2.

    Text Solution

    |

  5. The sides AB and AC and the perimeter P, of ∆ABC are respectively thre...

    Text Solution

    |

  6. The distribution given below, shows the marks obtained by 25 students ...

    Text Solution

    |

  7. The mean of the following distribution is 52 and the frequency of clas...

    Text Solution

    |

  8. In the figure, EF || AC, BC = 10 cm, AB = 13 cm and EC = 2 cm, find AF

    Text Solution

    |

  9. A Mathematics aptitude test of 50 students was recorded as follows: ...

    Text Solution

    |

  10. In the figure ABC and DBC are two right triangles. Prove that AP × PC ...

    Text Solution

    |

  11. Marks obtaind by 40 students in a short assessment is given below, whe...

    Text Solution

    |

  12. Find the mode and the median of the following data 13, 16, 12, 14, 19...

    Text Solution

    |

  13. The median of the following observation 11, 12, 14, (x - 2), (x + 4), ...

    Text Solution

    |

  14. The numbers 6, 8, 10 ,12, 13, and x are arranged in an ascending order...

    Text Solution

    |

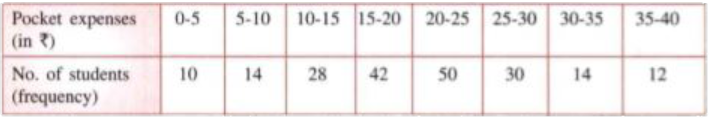
  15. (Use a graph paper for this question). The daily pocket expenses of 20...

    Text Solution

    |

  16. In the given figure, QA ⊥ AB and PB ⊥ AB. If AO = 20 cm, BO = 12 cm, P...

    Text Solution

    |

  17. The mean of the following numbers is 68. Find the value of 'x'. 45, ...

    Text Solution

    |

  18. The marks of 10 students of a class in an examination arranged in asce...

    Text Solution

    |

  19. In the given figure, CD || LA and DE || AC. Find the length of CL if B...

    Text Solution

    |

  20. The histogram below represents the scores obtained by 25 students in a...

    Text Solution

    |