Home
Class 12
PHYSICS
Which of the following graph(s) represen...

Which of the following graph(s) represent retardation ? [v : velocity, t : time, x : position]

A

B

C

D

Text Solution

AI Generated Solution

The correct Answer is:
To determine which of the given graphs represent retardation, we need to understand the concept of retardation in physics. Retardation refers to the decrease in the magnitude of velocity over time. Let's analyze the graphs step by step. ### Step-by-Step Solution: 1. **Understanding Retardation**: - Retardation occurs when the velocity of an object decreases over time. This means that as time progresses, the speed of the object is reducing. 2. **Analyzing Graph A (V vs. T)**: - In this graph, if we denote the initial velocity as \( V_1 \) and the final velocity as \( V_2 \), we observe that \( V_2 < V_1 \). - Since the velocity is decreasing, this graph represents retardation. 3. **Analyzing Graph B (V vs. T)**: - Similar to Graph A, if we denote the initial velocity as \( V_3 \) and the final velocity as \( V_4 \), we find that \( V_4 < V_3 \). - Again, since the velocity is decreasing, this graph also represents retardation. 4. **Analyzing Graph C (X vs. T)**: - This graph represents position vs. time. The slope of an X-T graph gives the velocity. - If the slope is constant, the velocity is constant, which means there is no change in velocity over time. Therefore, this graph does not represent retardation. 5. **Analyzing Graph D (V vs. T)**: - In this graph, we can see that the slope of the curve is changing. If we denote the initial slope (velocity) as \( V_1 \) and the later slope as \( V_2 \), where \( V_2 < V_1 \), we conclude that the velocity is decreasing. - Hence, this graph also represents retardation. ### Conclusion: The graphs that represent retardation are **Graph A, Graph B, and Graph D**.

To determine which of the given graphs represent retardation, we need to understand the concept of retardation in physics. Retardation refers to the decrease in the magnitude of velocity over time. Let's analyze the graphs step by step. ### Step-by-Step Solution: 1. **Understanding Retardation**: - Retardation occurs when the velocity of an object decreases over time. This means that as time progresses, the speed of the object is reducing. 2. **Analyzing Graph A (V vs. T)**: ...
Promotional Banner

Topper's Solved these Questions

  • TEST PAPERS

    RESONANCE ENGLISH|Exercise PART - II PHYSICS|106 Videos
  • TEST PAPERS

    RESONANCE ENGLISH|Exercise PHYSICS|784 Videos
  • TEST PAPERS

    RESONANCE ENGLISH|Exercise PHYSICS|784 Videos
  • SIMPLE HARMONIC MOTION

    RESONANCE ENGLISH|Exercise Advanced Level Problems|13 Videos
  • TEST SERIES

    RESONANCE ENGLISH|Exercise PHYSICS|130 Videos

Similar Questions

Explore conceptually related problems

Which of the following x-t graphs does not represent periodic motion?

The acceleration (a)-time(t) graph for a particle moving along a straight from rest is shown in figur. Which of the following graph is the best representation of its velocity (v) with time (t) ?

The acceleration (a)-time(t) graph for a particle moving along a straight from rest is shown in figure. Which of the following graph is the best representation of its velocity (v) with time (t) ?

Which of the following graph represents relation between the image position (v) and object position (u) from the concave lens.

The velocity v of a particle moving along x - axis varies with ist position (x) as v=alpha sqrtx , where alpha is a constant. Which of the following graph represents the variation of its acceleration (a) with time (t)?

Which of the following velocity-time graphs represent uniform motion

A body is thrown vertically upwards. Which one of the following graphs correctly represent the velocity vs time?

The graph shown the variation with times t of the velocity v of an object . Which one of the following graphs best represents the variation of acceleration a of the object with time t ?

A ball thrown vertically upward with initial velocity u. Which of the following graphs represent the velocity of ball correctly as function of time? (Take upward direction as positive)

RESONANCE ENGLISH-TEST PAPERS-PART - II PHYSICS SEC - 2
  1. The x- component of a certain vector in x-y plane is 2 units and y- co...

    Text Solution

    |

  2. The velocity of a particle is given by vec(v) = 2hat(i)-hat(j)+2hat(k)...

    Text Solution

    |

  3. Two bodies are thrown verically upward, with the same initially veloci...

    Text Solution

    |

  4. A particle is prejected from ground with speed 80 m/s at an angle 30^(...

    Text Solution

    |

  5. An astronaut is on the surface of other planet whose air resistance is...

    Text Solution

    |

  6. A stone is thrown from the top of a tower at an angle of 30^(@) above...

    Text Solution

    |

  7. A particle Is projected at point 'A' with initial velocity 5 m//s at a...

    Text Solution

    |

  8. A stone is projected from point P on the inclined plane with velocity ...

    Text Solution

    |

  9. A balloon is ascending at the constant rate of 9.8 m//sec at a height ...

    Text Solution

    |

  10. An elevator of height 'h' ascends with constant acceleration 'a'. When...

    Text Solution

    |

  11. The distance travelled by a particle is proportional to the square of ...

    Text Solution

    |

  12. At what angle of elevation , should a projectile be projected with vel...

    Text Solution

    |

  13. A particle is moving in a straight line. Its displacement at time t is...

    Text Solution

    |

  14. A ball is thrown vertically upwards in air. If the air resistance cann...

    Text Solution

    |

  15. Choose the incorrect option/options :

    Text Solution

    |

  16. A particle is moving along the x-axis whose position is given by x= 4...

    Text Solution

    |

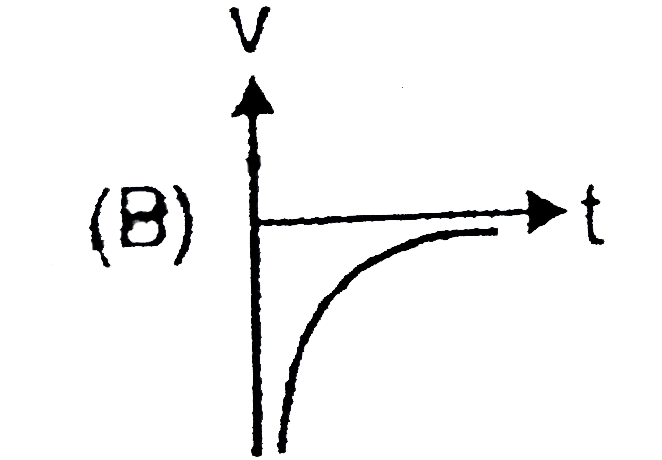
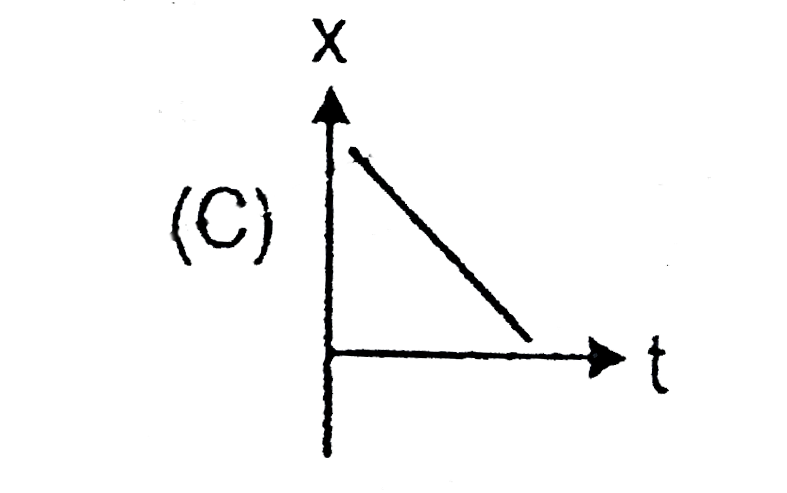
  17. Which of the following graph(s) represent retardation ? [v : velocity,...

    Text Solution

    |

  18. A partile is projected up an incline (inclination angle = 30^(@)) with...

    Text Solution

    |

  19. When two particles A and B are at point O, A is moving with a constant...

    Text Solution

    |

  20. A man standing on the edge of the terrace of a high rise building thro...

    Text Solution

    |