A
B
C
D
Text Solution
Verified by Experts
The correct Answer is:


Topper's Solved these Questions
KTG & THERMODYNAMICS
RESONANCE ENGLISH|Exercise Exercise-2|1 VideosKTG & THERMODYNAMICS
RESONANCE ENGLISH|Exercise PART -I|15 VideosKTG & THERMODYNAMICS
RESONANCE ENGLISH|Exercise PART -II|17 VideosKINETIC THEORY OF GASES AND THERMODYNAMICS
RESONANCE ENGLISH|Exercise Exercise|64 VideosMAGNETIC FIELD AND FORCES
RESONANCE ENGLISH|Exercise Exercise|64 Videos
Similar Questions
Explore conceptually related problems
RESONANCE ENGLISH-KTG & THERMODYNAMICS-SECTION
- What is the change in velocity in the above question?
Text Solution
|
- A Carnot engine works as a refrigerator in between 250K and 300K. If i...
Text Solution
|
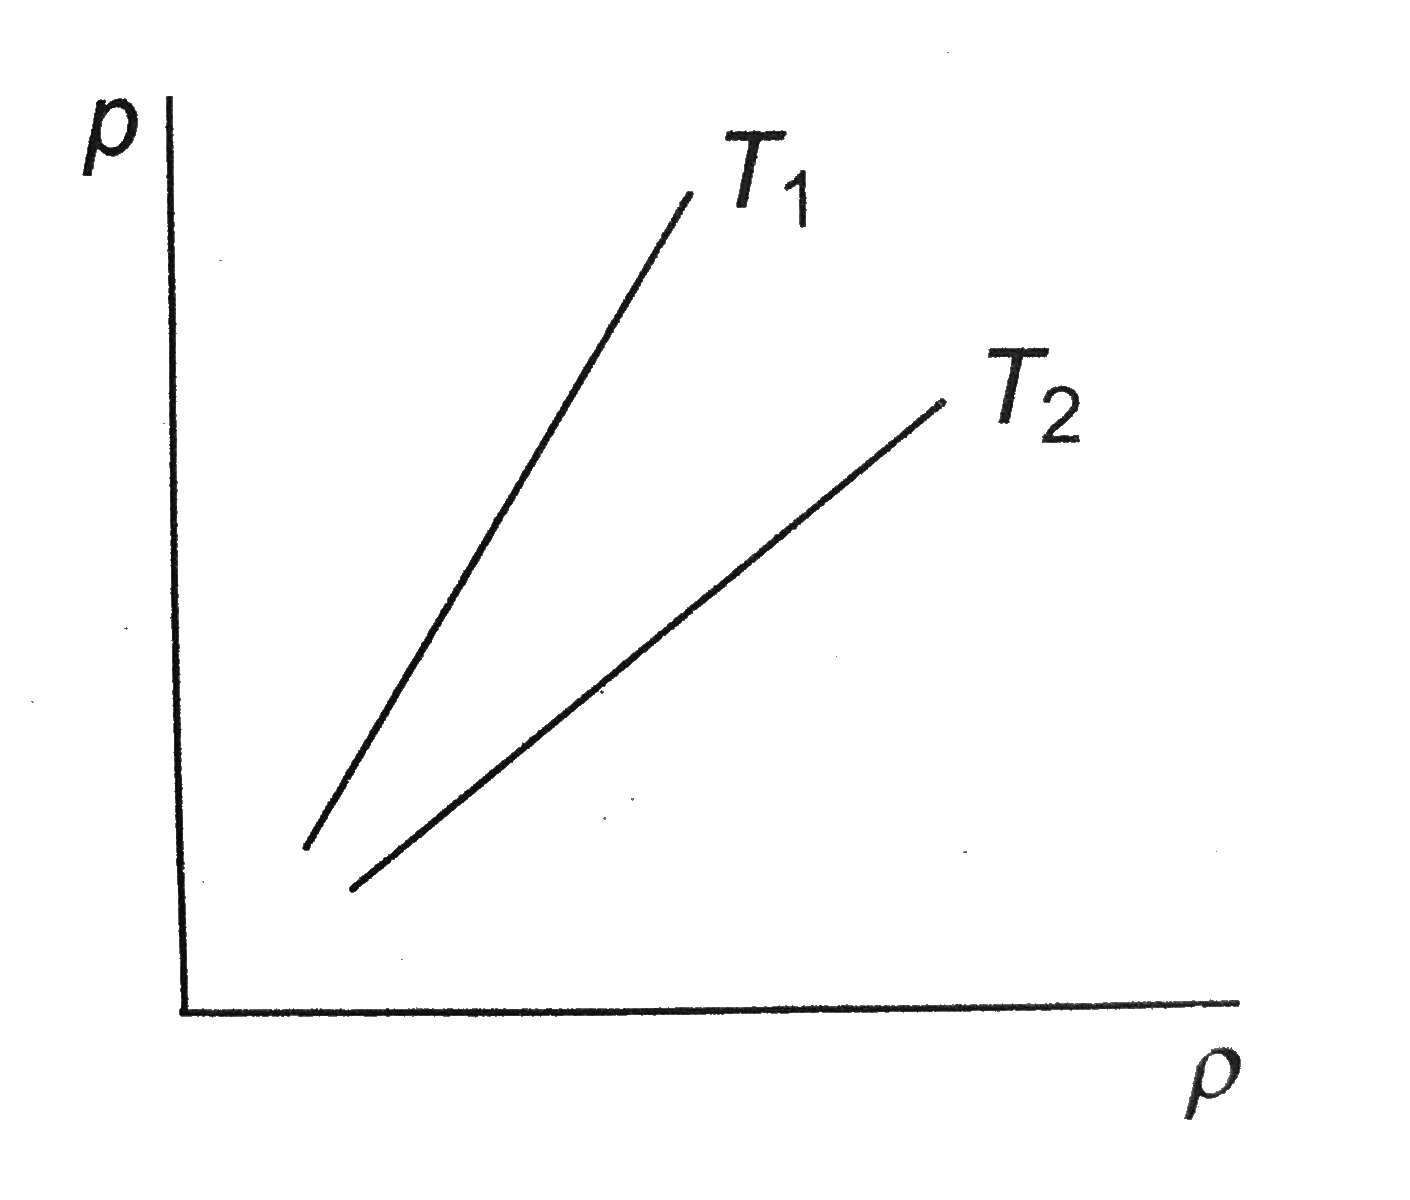
- Figure shows graphs of pressure vs density for an ideal gas at two tem...
Text Solution
|
- Suppose a container is evacuated to leave just one molecule of a gas i...
Text Solution
|
- The average speed of nitrogen molecules in a gas is v. If the temperat...
Text Solution
|
- Keeping the number of moles, volume and pressure the same, which of th...
Text Solution
|
- Four containers are filled with monoatomic ideal gases. For each conta...
Text Solution
|
- For a gas sample with N(0) number of molecules, function N(V) is given...
Text Solution
|
- A certain gas is taken to the five states representes by dots in the g...
Text Solution
|
- Which of the following quantities is the same for all ideal gases at t...
Text Solution
|
- Refer to figure. Let DeltaU(1) and DeltaU(2) be the changes in interna...
Text Solution
|
- The quantity (2U)/(fkT) represents (where U = internal energy of gas)
Text Solution
|
- An ideal gas change from state a to state b as shown in Fig. what is t...
Text Solution
|
- Pressure versus temperature graph of an ideal gas as shown in Fig. C...
Text Solution
|
- The process DeltaU = 0, for an ideal gas can be best represented in th...
Text Solution
|
- In the given (V-T) diagram, what is the relation between pressure P(1)...
Text Solution
|
- In a cyclic process shown on the P -V diargam the magnitude of the wor...
Text Solution
|
- A fixed mass of an ideal gas undergoes changes of pressure and volume ...
Text Solution
|
- In figure, P-V curve of an ideal gas is given. During the process, the...
Text Solution
|
- Consider two processes on a system as shown in figure. The volumes in...
Text Solution
|