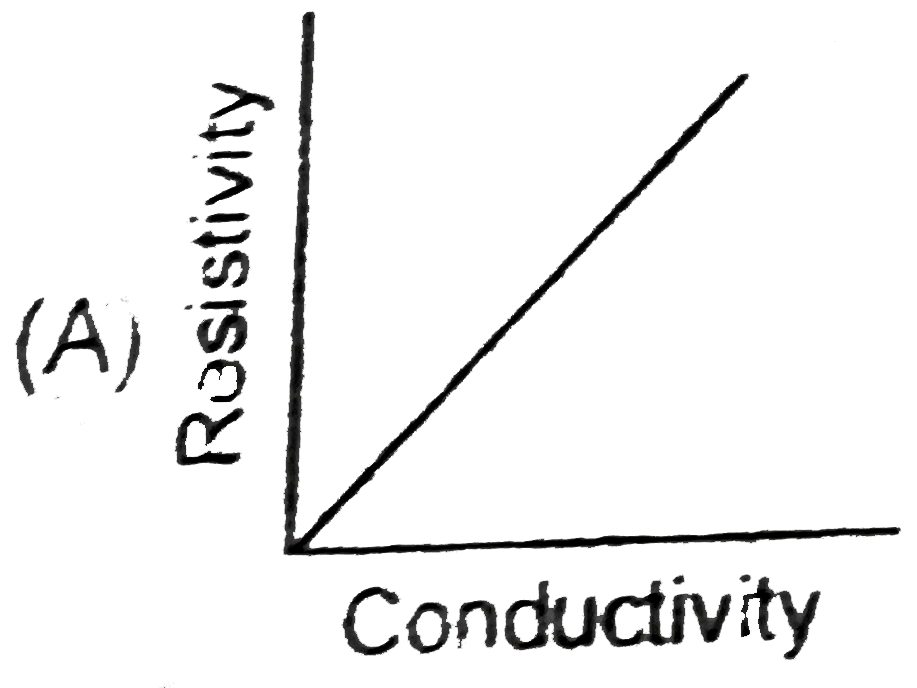
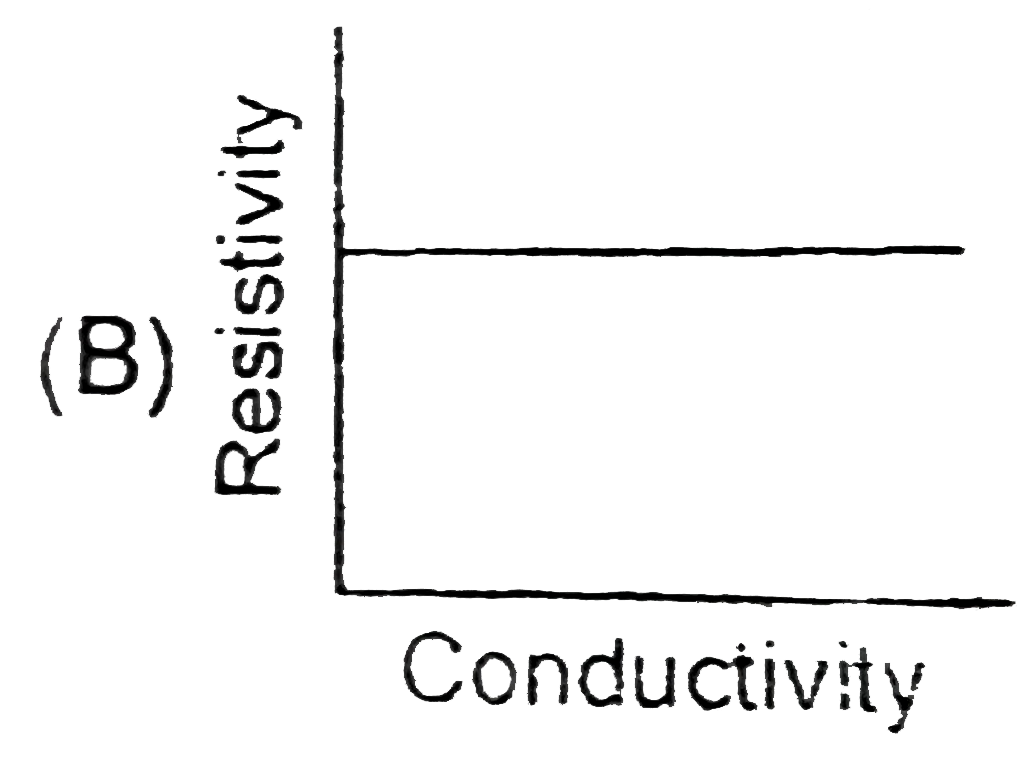
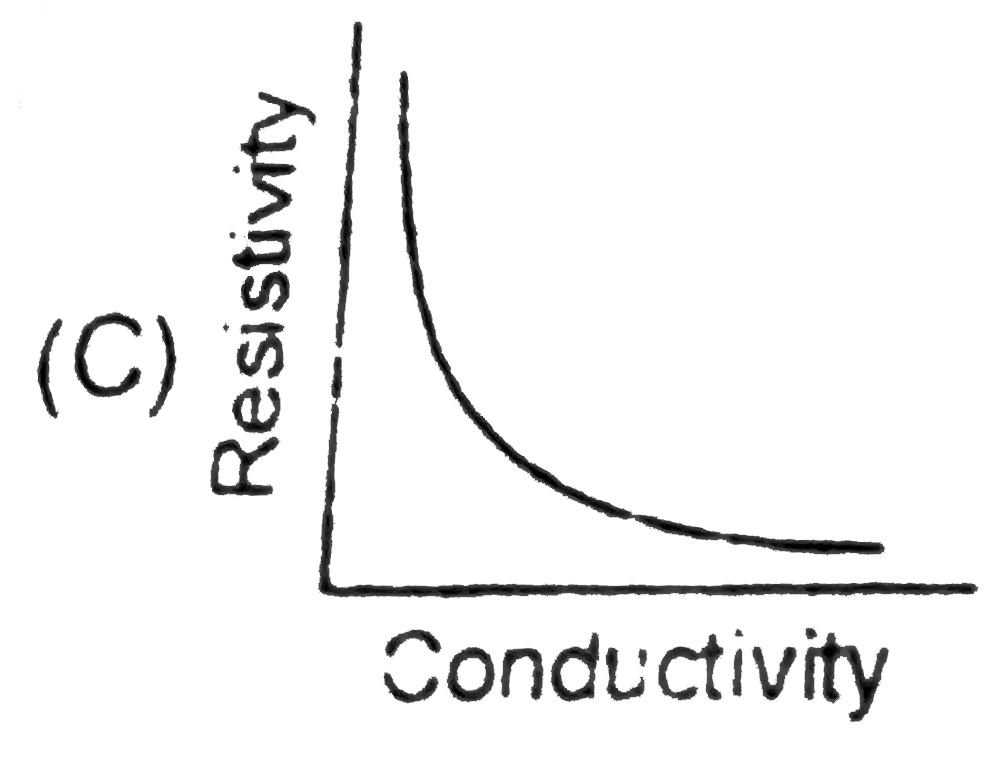
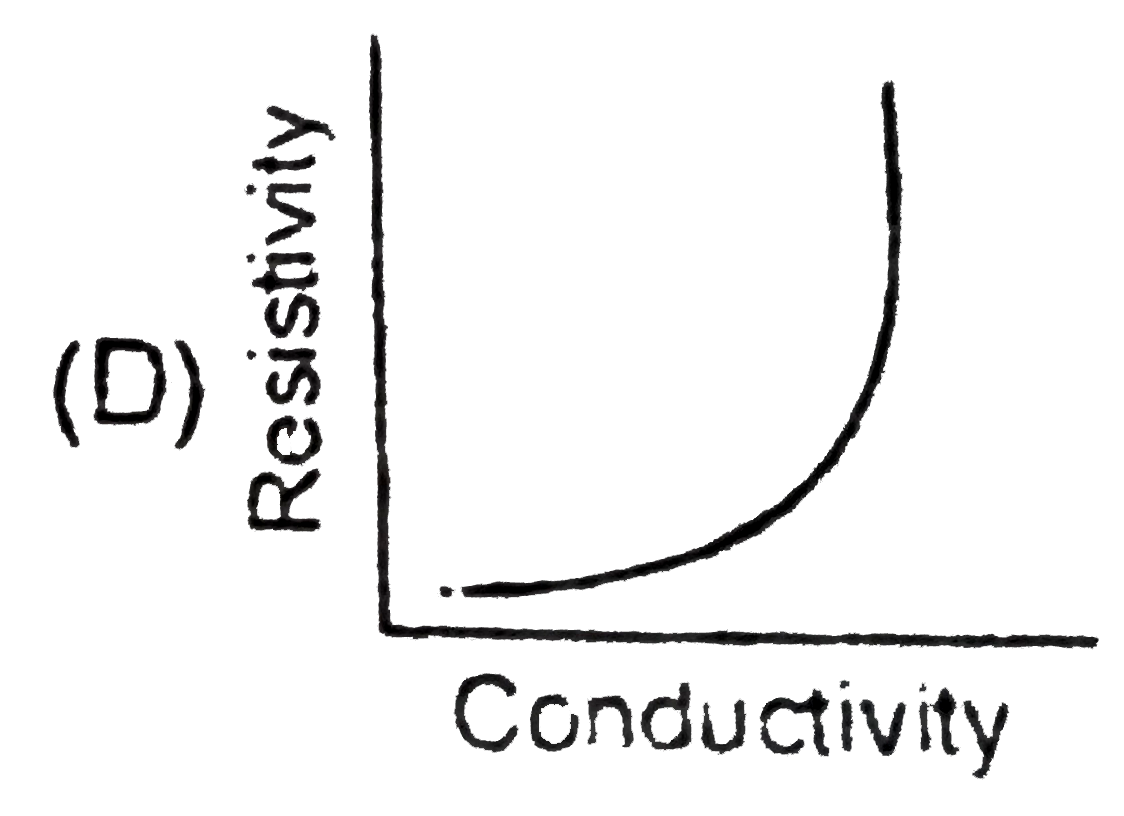
Home
Class 12
PHYSICS
Which graph best represent the relations...

Which graph best represent the relationship between conductivity and resistivity for a solid ?

A

B

C

D

Text Solution

AI Generated Solution

The correct Answer is:
To determine the relationship between conductivity and resistivity for a solid, we can follow these steps: ### Step-by-Step Solution: 1. **Understand the Definitions**: - Conductivity (σ) is a measure of a material's ability to conduct electric current. - Resistivity (ρ) is a measure of how strongly a material opposes the flow of electric current. 2. **Establish the Relationship**: - The relationship between conductivity and resistivity is given by the formula: \[ \sigma = \frac{1}{\rho} \] - This indicates that conductivity is inversely proportional to resistivity. 3. **Analyze the Implications**: - If resistivity (ρ) increases, conductivity (σ) decreases, and vice versa. - This means that as you plot conductivity on the x-axis and resistivity on the y-axis, the graph will show a hyperbolic relationship. 4. **Graphical Representation**: - The relationship can be expressed as: \[ \sigma \cdot \rho = 1 \] - Rearranging this gives us: \[ \rho = \frac{1}{\sigma} \] - This indicates that the graph will be a hyperbola, where as conductivity increases, resistivity decreases. 5. **Identify the Correct Graph**: - Given the options A, B, C, and D, we need to find the graph that represents a hyperbolic curve. - Upon examining the options, option C represents this hyperbolic relationship correctly. 6. **Conclusion**: - Therefore, the graph that best represents the relationship between conductivity and resistivity for a solid is option C.

To determine the relationship between conductivity and resistivity for a solid, we can follow these steps: ### Step-by-Step Solution: 1. **Understand the Definitions**: - Conductivity (σ) is a measure of a material's ability to conduct electric current. - Resistivity (ρ) is a measure of how strongly a material opposes the flow of electric current. ...
Promotional Banner

Topper's Solved these Questions

  • DAILY PRACTICE PROBLEM

    RESONANCE ENGLISH|Exercise DPP No.36|20 Videos
  • DAILY PRACTICE PROBLEM

    RESONANCE ENGLISH|Exercise DPP No.37|9 Videos
  • DAILY PRACTICE PROBLEM

    RESONANCE ENGLISH|Exercise DPP No.34|9 Videos
  • CURRENT ELECTRICITY

    RESONANCE ENGLISH|Exercise High Level Problems (HIP)|19 Videos
  • ELECTRO MAGNETIC WAVES

    RESONANCE ENGLISH|Exercise Exercise 3|27 Videos

Similar Questions

Explore conceptually related problems

Which graph represents positive acceleration ?

Which of the graphs shown below does not represent the relationship between incident light and the electron ejected from metal surface ?

Which of the graphs shown below does not represent the relationship between incident light and the electron ejected from metal surface?

Which of the graphs shown below does not represent the relationship between incident light and the electron ejected from metal surface?

A coffee shop noticed that the outside temperature affected the number of customers who came to the shop that day, as shown in the table above. Which of the following graphs best represents the relationship between the outside temperature t, and the number of customers,n, as indicated by the table?

A small bar magnet is being slowly inserted with constant velocity inside a solenoid as shown in figure. Which graph best represents the relationship between emf induced with time

Consider circuit as shown . Which of the graph best represent V-l relationship across the variable resistance R.

Which of the following graphs represents the relationship between the force F between two point charges and the distance r between them :

RESONANCE ENGLISH-DAILY PRACTICE PROBLEM-DPP No.35
  1. The figure shows two large, closely parallel, nonconducting sheets wit...

    Text Solution

    |

  2. The displacement time graphs of two bodies A and B are shown in figure...

    Text Solution

    |

  3. For the given situation shown in figure , choose the correct option (g...

    Text Solution

    |

  4. Using mass (M) , length (L) , time (T) , and electric current (A) as f...

    Text Solution

    |

  5. In a region of uniform electric field vec(E) = E(0) hat (i) a semi cyl...

    Text Solution

    |

  6. A soap film is created in a small wire frame as shown in the figure. T...

    Text Solution

    |

  7. In a binary star system one star has thrice the mass of other. The sta...

    Text Solution

    |

  8. A small object is placed at distance of 3.6 cm from a magnifier of fo...

    Text Solution

    |

  9. An ideal fluid flows through a pipe of circular cross-section made of ...

    Text Solution

    |

  10. The angle of contact at the interface of water-glass is 0^(@) , ethyl ...

    Text Solution

    |

  11. Which graph best represent the relationship between conductivity and r...

    Text Solution

    |

  12. Through an electrolyte an electrical current is due to drift of

    Text Solution

    |

  13. A electric current passes through non uniform cross-section wire made ...

    Text Solution

    |

  14. A body of mass m is lifted up from the surface of earth to a height th...

    Text Solution

    |

  15. Specific resistance of a wire depends on its

    Text Solution

    |

  16. In the circuit shown, the galvanometer shows zero current. The value o...

    Text Solution

    |

  17. An ammeter and a voltmeter are initially connected in series to a batt...

    Text Solution

    |

  18. A cone made of a materal of relative density (d = (27)/(64)) and heigh...

    Text Solution

    |

  19. A U-tube of uniform cross section is partially filled with a liquid I....

    Text Solution

    |

  20. Imagine a short diploe at the center of a spherical surface. If the ma...

    Text Solution

    |