Home
Class 11
PHYSICS
The graph between the binding energy per...

The graph between the binding energy per nucleon (E) and atomic mass number (A) is as-

A

B

C

D

Text Solution

AI Generated Solution

The correct Answer is:
To solve the question regarding the graph between binding energy per nucleon (E) and atomic mass number (A), we will follow these steps: ### Step 1: Understand the Definitions - **Binding Energy (BE)**: This is the energy required to disassemble a nucleus into its constituent protons and neutrons. - **Binding Energy per Nucleon (E)**: This is the binding energy divided by the total number of nucleons (protons + neutrons). It gives an idea of how tightly bound the nucleons are within the nucleus. ### Step 2: Relate Binding Energy to Atomic Mass Number - The atomic mass number (A) is defined as the total number of nucleons in a nucleus, i.e., A = Z + N, where Z is the number of protons and N is the number of neutrons. ### Step 3: Analyze the Trend of Binding Energy per Nucleon - As the atomic mass number (A) increases, the binding energy per nucleon initially increases. This is due to the strong nuclear force that acts between nucleons, which becomes more effective as more nucleons are added to the nucleus. - After reaching a certain point, the binding energy per nucleon starts to decrease. This is because, as the nucleus gets larger, the repulsive forces between protons (which are positively charged) begin to outweigh the attractive forces, leading to a decrease in binding energy per nucleon. ### Step 4: Sketch the Graph - The graph will show binding energy per nucleon (E) on the y-axis and atomic mass number (A) on the x-axis. - Initially, the graph will rise, indicating an increase in binding energy per nucleon with increasing A. - After reaching a peak, the graph will start to decline, indicating a decrease in binding energy per nucleon as A continues to increase. ### Step 5: Identify the Correct Option - Based on the analysis, the correct representation of the graph is one that shows an initial increase followed by a decrease in binding energy per nucleon as atomic mass number increases. Thus, the answer is option number four, which correctly depicts this trend. ---
Promotional Banner

Topper's Solved these Questions

  • NEWTONS LAWS OF MOTION AND FRICTION

    RESONANCE ENGLISH|Exercise Exercise|56 Videos
  • PART TEST 1

    RESONANCE ENGLISH|Exercise Exercise|30 Videos

Similar Questions

Explore conceptually related problems

The value of binding energy per nucleon is

The curve of blinding energy per nucleon as a function of atomic mass number has a sharp peak for helium nucleus. This implies that helium.

The curve of blinding energy per nucleon as a function of atomic mass number has a sharp peak for helium nucleus. This implies that helium.

The curve of blinding energy per nucleon as a function of atomic mass number has a sharp peak for helium nucleus. This implies that helium.

Assume that the nuclear binding energy per nucleon (B/A) versus mass number (A) is as shown in the figure. Use this plot to choose the correct choice(s) given below. Figure

Assertion The binding energy per nucleon, for nuclei with atomic mass number A gt 100 , decreases with A . Reason The nuclear forces are weak for heavier nuclei.

The dependence of binding energy per nucleon, B_N on the mass number, A is represented by. (a) , (b) , ( c) , (d) .

The binding energy per nucleon is maximum in the case of.

The binding energy per nucleon is maximum in the case of.

Draw the graph showing thervariation of binding energy per nucleon with mass number. Give therason for the decrease of binding energy per nucleon for nuclei with high mass numbers. The binding energy per nucleon for nuclei with high mass number is low due to the large coulomb repulsion between the protons inside these nuclei.

RESONANCE ENGLISH-NUCLEAR PHYSICS-Exercise
  1. Slow neutron are sometimes refer to as thermal neutrons because

    Text Solution

    |

  2. Which of the following is correct about nuclear forces?

    Text Solution

    |

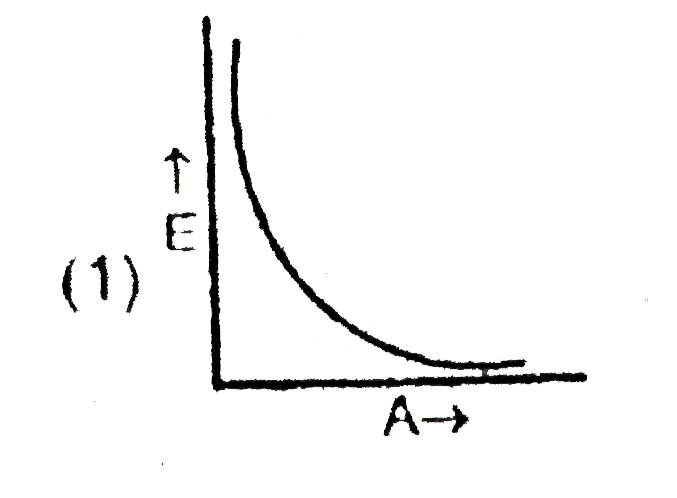
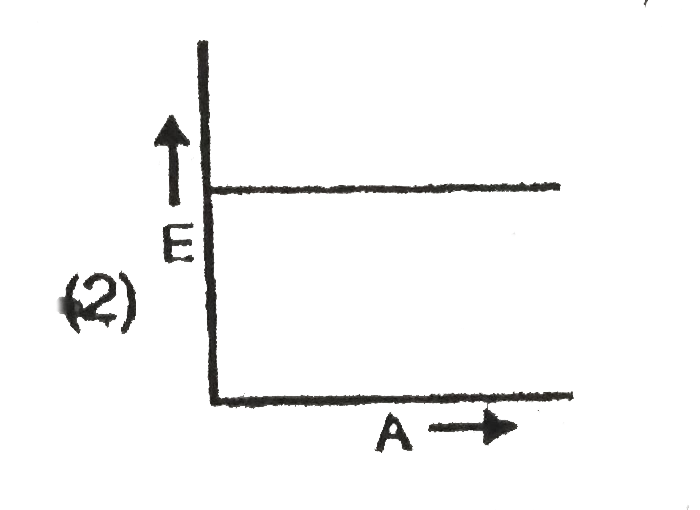
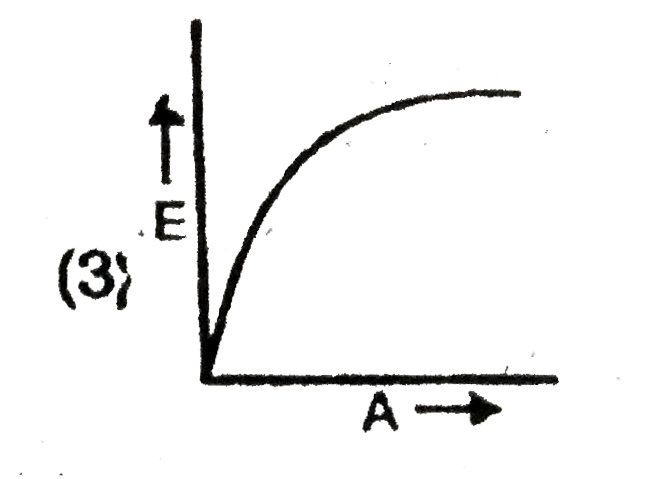
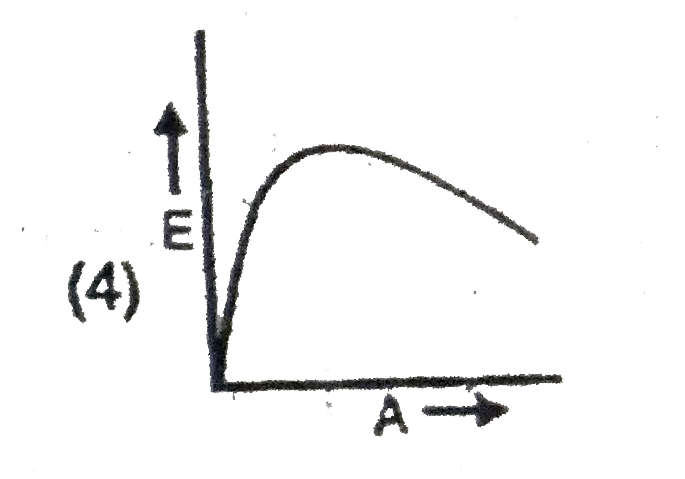
  3. The graph between the binding energy per nucleon (E) and atomic mass n...

    Text Solution

    |

  4. The probability of a radioactive atoms to survive 5 times longer than ...

    Text Solution

    |

  5. After emission of an alpha-particle by a radiative element .(84)X^(212...

    Text Solution

    |

  6. The SI unit of activity is-

    Text Solution

    |

  7. The specific activity of radius is nearly-

    Text Solution

    |

  8. After a time equal to four half lives, the amount of radioactive mater...

    Text Solution

    |

  9. The mean of life of a radioactive sample is 100 years. Then after 100 ...

    Text Solution

    |

  10. The count rate of 10 g of radioactive material was measured at differe...

    Text Solution

    |

  11. How many atoms decay in one mean life time of a radioactive sample-

    Text Solution

    |

  12. The half life of radioactive substance is T. Then the fraction of the ...

    Text Solution

    |

  13. The half-life of a radioactive substance is 3h and its activity is 1mu...

    Text Solution

    |

  14. The half -life of cobalt-60 is 5.25 years. How long after a new sample...

    Text Solution

    |

  15. A radioactive element ThA( .(84)Po^(216)) can undergo alpha and beta a...

    Text Solution

    |

  16. A radioactive nucleus undergoes a series of decay according to the sch...

    Text Solution

    |

  17. Compare the ionising power of alpha, beta and gamma radiations.

    Text Solution

    |

  18. In nuclear power station energy of uranium is used for producing-

    Text Solution

    |

  19. The order of magnitude of the density of nuclear matter is=

    Text Solution

    |

  20. The Process by which a heavy nucleus splits into light nuclei is known...

    Text Solution

    |