Home
Class 12
PHYSICS
Which one of the following graphs in fig...

Which one of the following graphs in figure shows the variation of photoelectric current `(I)` with voltage `(V)` between the electrodes in a photoelectric cell?

A

B

C

D

Text Solution

AI Generated Solution

The correct Answer is:
To determine the correct graph that shows the variation of photoelectric current \( I \) with voltage \( V \) between the electrodes in a photoelectric cell, we can analyze the behavior of the photoelectric effect under varying voltage conditions. ### Step-by-step Solution: 1. **Understanding the Photoelectric Effect**: - When light of sufficient frequency strikes a photoelectric material, it ejects electrons. The ejected electrons contribute to the photoelectric current. 2. **Current at Zero Voltage**: - When the voltage \( V \) is zero, there is no potential difference to drive the electrons towards the anode. Therefore, the photoelectric current \( I \) is also zero. This means that any graph where the current is non-zero when \( V = 0 \) is incorrect. 3. **Increasing Voltage**: - As the voltage \( V \) increases, the electric field accelerates the ejected electrons towards the anode, increasing the current \( I \). Initially, the current increases with increasing voltage. 4. **Saturation Current**: - After reaching a certain voltage, the current reaches a maximum value known as the saturation current. This occurs when all the emitted electrons are collected at the anode, and further increases in voltage do not increase the current. 5. **Reverse Voltage**: - If the voltage is reversed (negative voltage), the current will decrease and eventually become zero as the electric field opposes the movement of the emitted electrons. However, there may still be a small reverse current due to the few electrons that can still reach the anode. 6. **Analyzing the Options**: - Based on the above understanding: - **Option A**: Starts at zero current when \( V = 0 \) and increases to a saturation current, which is consistent with our analysis. - **Option B**: Shows current decreasing to zero with increasing voltage, which is incorrect. - **Option C**: Shows a large increase in current with a small increase in voltage, which is also incorrect. - **Option D**: Shows non-zero current at zero voltage, which is incorrect. 7. **Conclusion**: - The correct graph that represents the variation of photoelectric current \( I \) with voltage \( V \) is **Option A**.

To determine the correct graph that shows the variation of photoelectric current \( I \) with voltage \( V \) between the electrodes in a photoelectric cell, we can analyze the behavior of the photoelectric effect under varying voltage conditions. ### Step-by-step Solution: 1. **Understanding the Photoelectric Effect**: - When light of sufficient frequency strikes a photoelectric material, it ejects electrons. The ejected electrons contribute to the photoelectric current. 2. **Current at Zero Voltage**: ...
Promotional Banner

Topper's Solved these Questions

  • ATOMIC PHYSICS

    RESONANCE ENGLISH|Exercise Exercise (2) Only one option correct type|30 Videos
  • ATOMIC PHYSICS

    RESONANCE ENGLISH|Exercise Exercise-2 part-II Single and double value integer type|12 Videos
  • ATOMIC PHYSICS

    RESONANCE ENGLISH|Exercise Exercise 1 Part-1 subjective questions|35 Videos
  • ALTERNATING CURRENT

    RESONANCE ENGLISH|Exercise HIGH LEVEL PROBLEMS|11 Videos
  • CAPACITANCE

    RESONANCE ENGLISH|Exercise High Level Problems|16 Videos

Similar Questions

Explore conceptually related problems

Variation of photoelectric current with anode potential

Which one of the following shows crossing over and variations

Which of the following statement is(are) true in the context of photoelectric effect

Which of the following is the graph showing stress-strain variation for elastomers ?

The following graph shows the variation of photoelectric current for a photosensitive metal . Identify the variable X on the horizontal line.

A point source of light is used in an experiment on photoelectric effect . Which of the following curves best represents the variation of photo current (i) with distance (d) of the source from the emitter ?

Which one of the following is true in photoelectric emission

Which one of the following graphs shows the variation of magnetic induction B which distance r from a long wire carrying a current ?

Which of the following statements is correct regarding the photoelectric experiment ?

Why caesium and potassium are used as electrodes in photoelectric cells ?

RESONANCE ENGLISH-ATOMIC PHYSICS-Exercise ( Part II : Only one one correct type)
  1. If the frequency of light in a photoelectric experiment is doubled, th...

    Text Solution

    |

  2. Two separate monochromatic light beams A and B of the same intensity (...

    Text Solution

    |

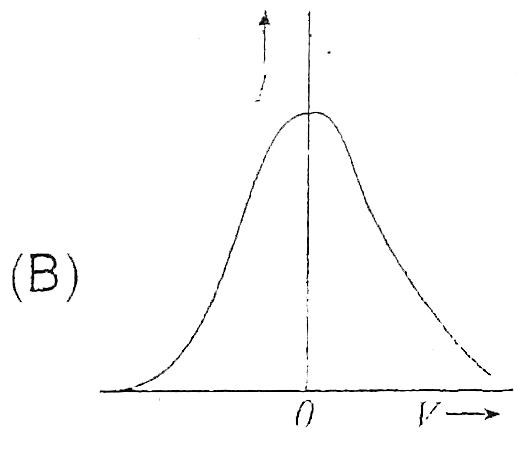
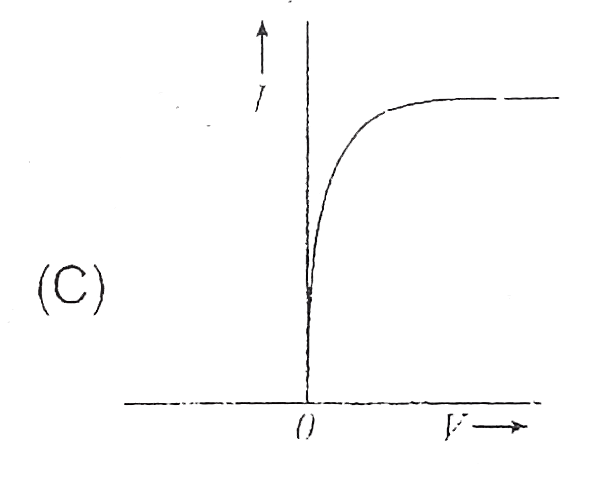
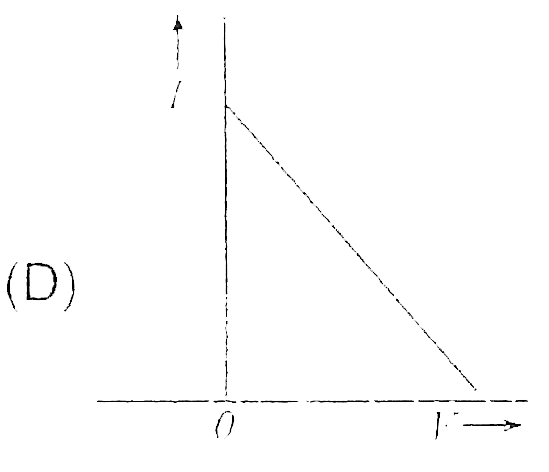
  3. Which one of the following graphs in figure shows the variation of pho...

    Text Solution

    |

  4. When a metalic surface is illuminated with light of wavelength lambda,...

    Text Solution

    |

  5. The anode plate in an experiment on photoelectric effect is kept verti...

    Text Solution

    |

  6. The maximum kinetic energy of photoelectrons emitted from a surface wh...

    Text Solution

    |

  7. A photon of light enters a block of glass after travelling through vac...

    Text Solution

    |

  8. We may state that the energy E of a photon of frequency nu is E =hnu, ...

    Text Solution

    |

  9. The de- Broglie wavelength of an electron moving with a velocity 1.5xx...

    Text Solution

    |

  10. A partical of mass M at rest decays into two Particles of masses m1 ...

    Text Solution

    |

  11. Let p and E denote the linear momentum and the energy of photon. For a...

    Text Solution

    |

  12. The de-Broglie wavelength of a neutron corresponding to root mean squa...

    Text Solution

    |

  13. The wavelength lambda of de Broglie waves associated with an electron ...

    Text Solution

    |

  14. The orbital speed of the electron in the ground state of hydrogen is v...

    Text Solution

    |

  15. The total energy of an electron in the first excited state of hydrogen...

    Text Solution

    |

  16. In above Q., the potential energy of the electron is:

    Text Solution

    |

  17. If a(0) is the Bohr radius, the radius of then n=2 electronic orbit in...

    Text Solution

    |

  18. Ionisation energy of a hydrogen-like ion A is greater than that of ano...

    Text Solution

    |

  19. Which energy state of doubly ionized lithium Li^(++) has the same ener...

    Text Solution

    |

  20. In Bohr's model of hydrogen atom a(0) is the radius of the ground stat...

    Text Solution

    |