A
B
C
D
Text Solution
Verified by Experts
The correct Answer is:


Topper's Solved these Questions
ORGANIC REACTION MECHANISMS-IV
RESONANCE ENGLISH|Exercise Exercise-2 Part-4|8 VideosORGANIC REACTION MECHANISMS-IV
RESONANCE ENGLISH|Exercise Exercise-3 Part-1|18 VideosORGANIC REACTION MECHANISMS-IV
RESONANCE ENGLISH|Exercise Exercise-2 Part-2|7 VideosORGANIC REACTION MECHANISMS - II
RESONANCE ENGLISH|Exercise APSP Part - 3|22 VideosPERIODIC TABLE & PERIODICITY
RESONANCE ENGLISH|Exercise ORGANIC CHEMISTRY(BASIC CONCEPTS)|27 Videos
Similar Questions
Explore conceptually related problems
RESONANCE ENGLISH-ORGANIC REACTION MECHANISMS-IV-Exercise-2 Part-3
- Predict the products expected in the given reaction 2-Bromo-1,1-dime...
Text Solution
|
- Which of the following order is/are correct for the rate of E2 reactio...
Text Solution
|
- Which of the following statement (s) is/are true about the following e...
Text Solution
|
- In which reaction product formation takes place by Hoffmann rule ?
Text Solution
|
- Which of the following compounds can give E1cB reaction ?
Text Solution
|
- Which of the following statement (s) is/are correct
Text Solution
|
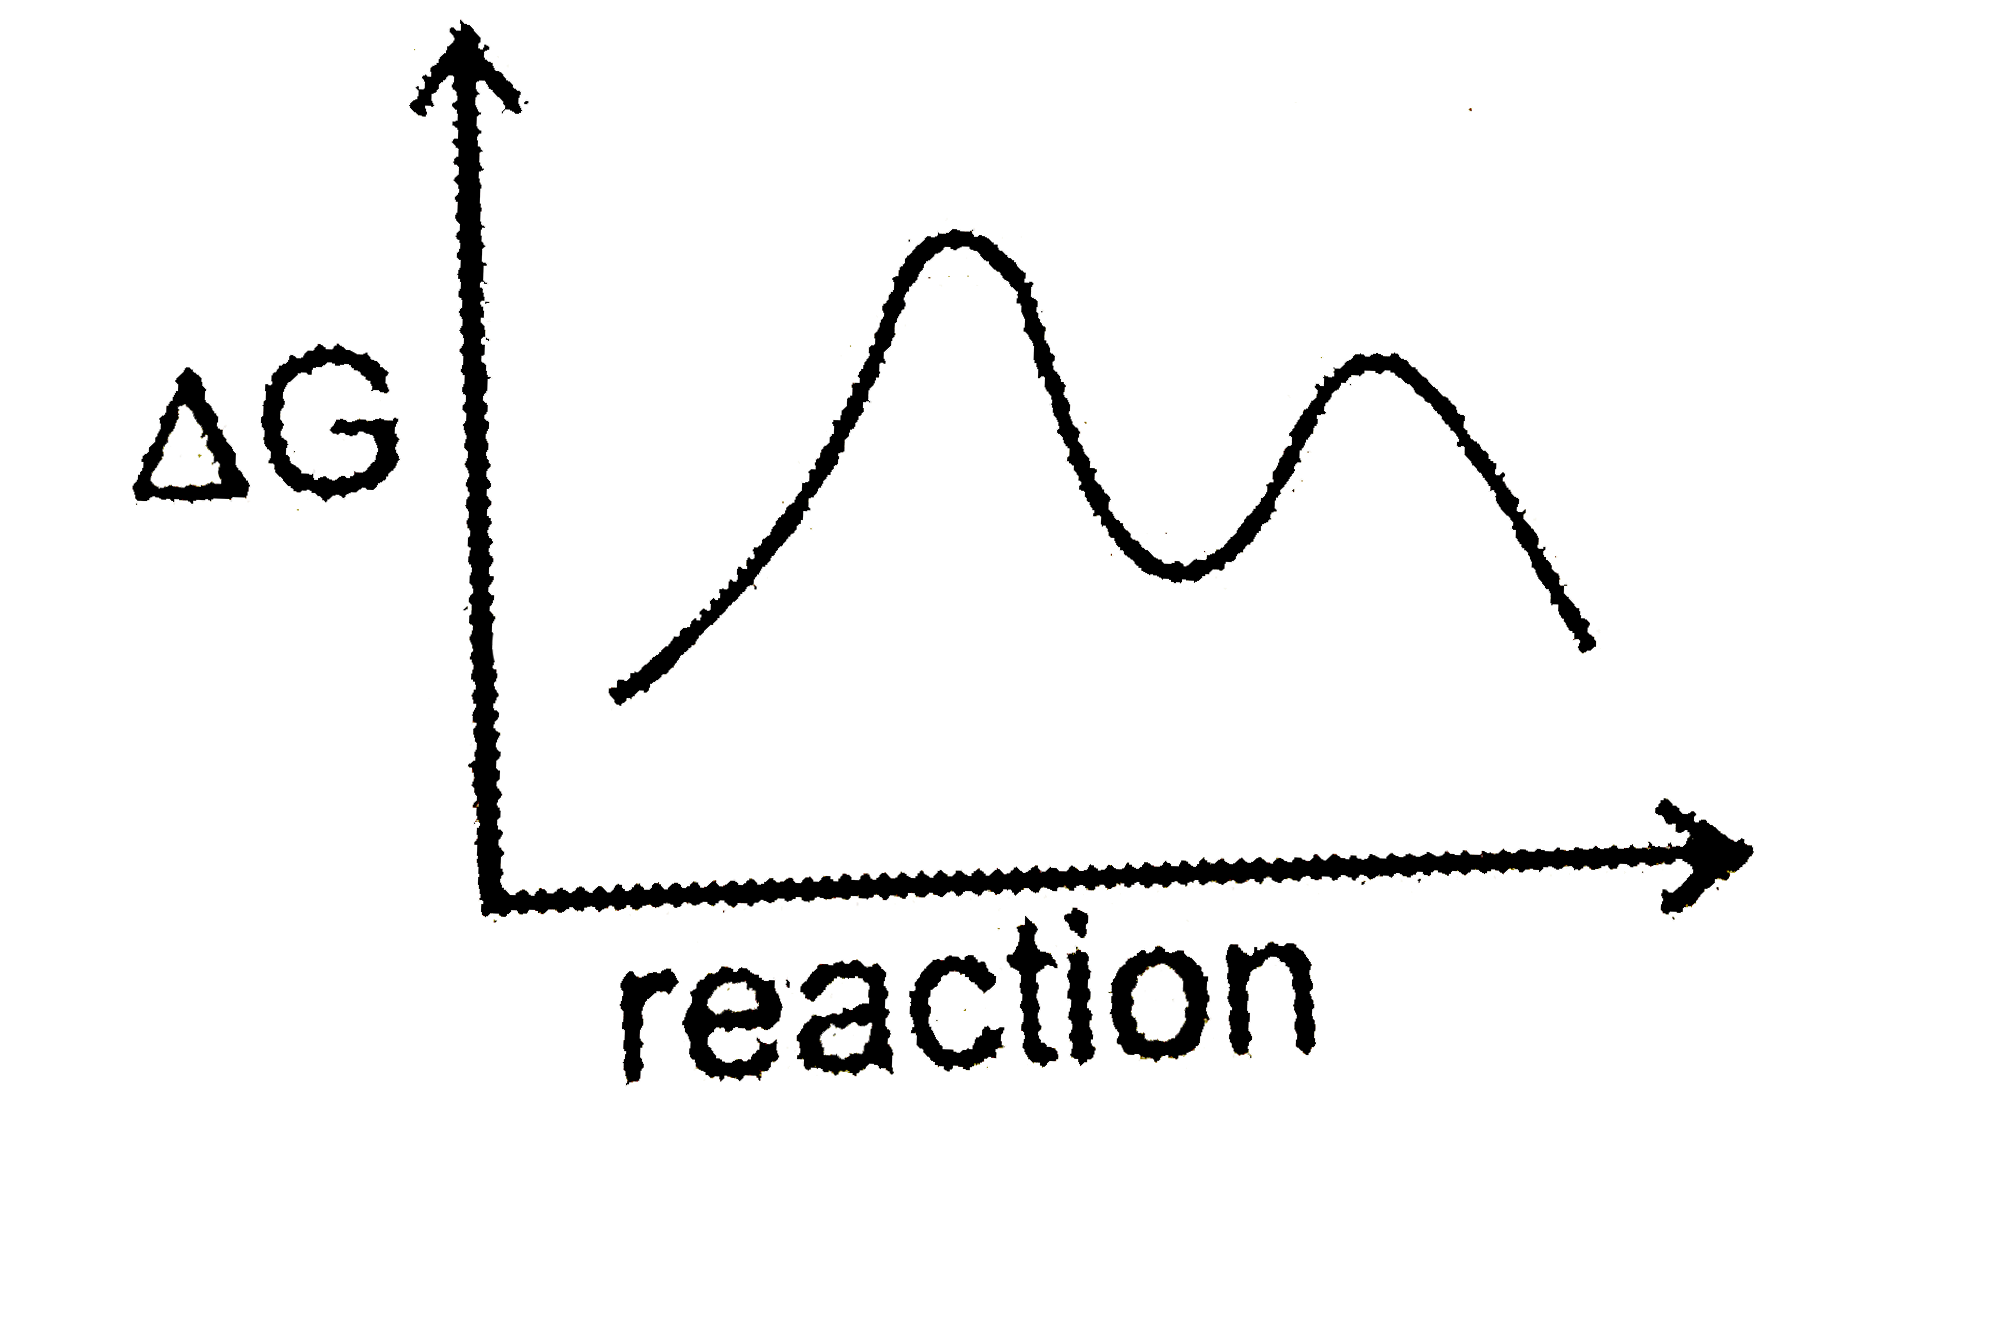
- Following graph between DeltaG and reaction progress in for/can be :
Text Solution
|
- Which observation will be correct about the major products X and Y of ...
Text Solution
|
- In which of the following reaction, regioselectivity cannot be observe...
Text Solution
|
- CH3-CH2-undersetunderset(CH3)(|)oversetoverset(Cl)(|)C-CH2-CH3overset(...
Text Solution
|