The given graph shows the variation of velocity with displacement. Which one of the graphs given below correctly represents the variation of acceleration with displacement ?
The given graph shows the variation of velocity with displacement. Which one of the graphs given below correctly represents the variation of acceleration with displacement ?
The given (p - U) graph shows the variation of internal energy of an ideal gas with increase in pressure. Which of the following pressure - volume graph is equivalent to this graph ? .
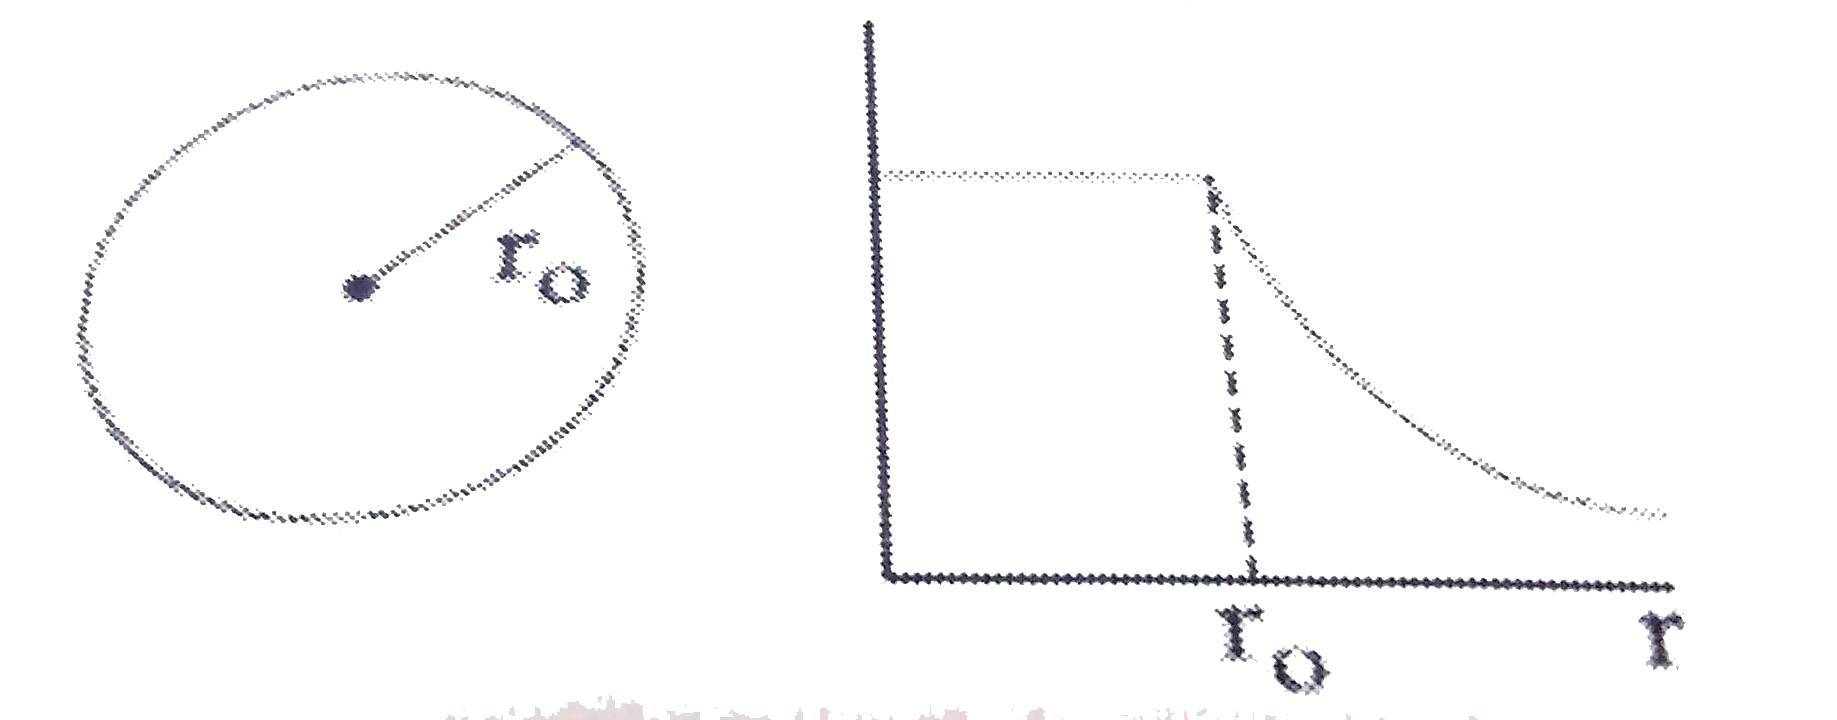
The magnetic field within cylindrical region whose cross - section is indicated starts increasing at a constant rate alpha tesla/sec . The graph showing the variation of induced field with distance r from the axis of cylinder is :
In the circuit shown below, the internal resistance of the cell is negligible. The distance of the slider from the left-hand end of the slide wire is l. The graph shows the variation with l of the current I in the cell. Value of the resistance R is:
The graph shows the variation of displacement of a particle execting SHM with time . We infer from this graph that
In the circuit shown below, the internal resistance of the cell is negligible. The distance of the slider from the left-hand end of the slide wire is l. The graph shows the variation with l of the current I in the cell. E.M.F. of the cell is:
In the circuit shown below, the internal resistance of the cell is negligible. The distance of the slider from the left-hand end of the slide wire is l. The graph shows the variation with l of the current I in the cell. The balance point is at length l that is equal to:
The graph shown the variation with times t of the velocity v of an object . Which one of the following graphs best represents the variation of acceleration a of the object with time t ?
The graph shows the variation of displacement of a particle executing S.H.M with time. We inference form this graph that :-
VMC MODULES ENGLISH-JEE Main Revision Test-6 | JEE-2020 -PHYSICS