A
B
C
D
Text Solution
Verified by Experts
The correct Answer is:


Topper's Solved these Questions
Similar Questions
Explore conceptually related problems
VMC MODULES ENGLISH-JEE MAIN REVISION TEST - 13-CHEMISTRY (SECTION 2)
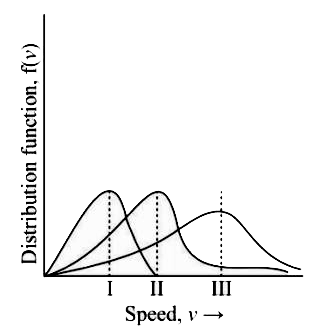
- Points I, II and III in the following plot respectively correspond to ...
Text Solution
|
- The sum of number of stereo centers present in linear and cyclic struc...
Text Solution
|
- For the reaction of H(2) with I(2), the constant is 2.5 xx 10^(-4) dm^...
Text Solution
|
- The difference between DeltaH and DeltaU (DeltaH - DeltaU), when th...
Text Solution
|
- The highest possible oxidation states of uranium is.
Text Solution
|
- The ratio of number of pentagons in C(60) and trigons (triangles) in ...
Text Solution
|