A
B
C
D
Text Solution
Verified by Experts
The correct Answer is:


Topper's Solved these Questions
Similar Questions
Explore conceptually related problems
VMC MODULES ENGLISH-JEE MAIN REVISION TEST -14 -PHYSICS (SECTON 2)
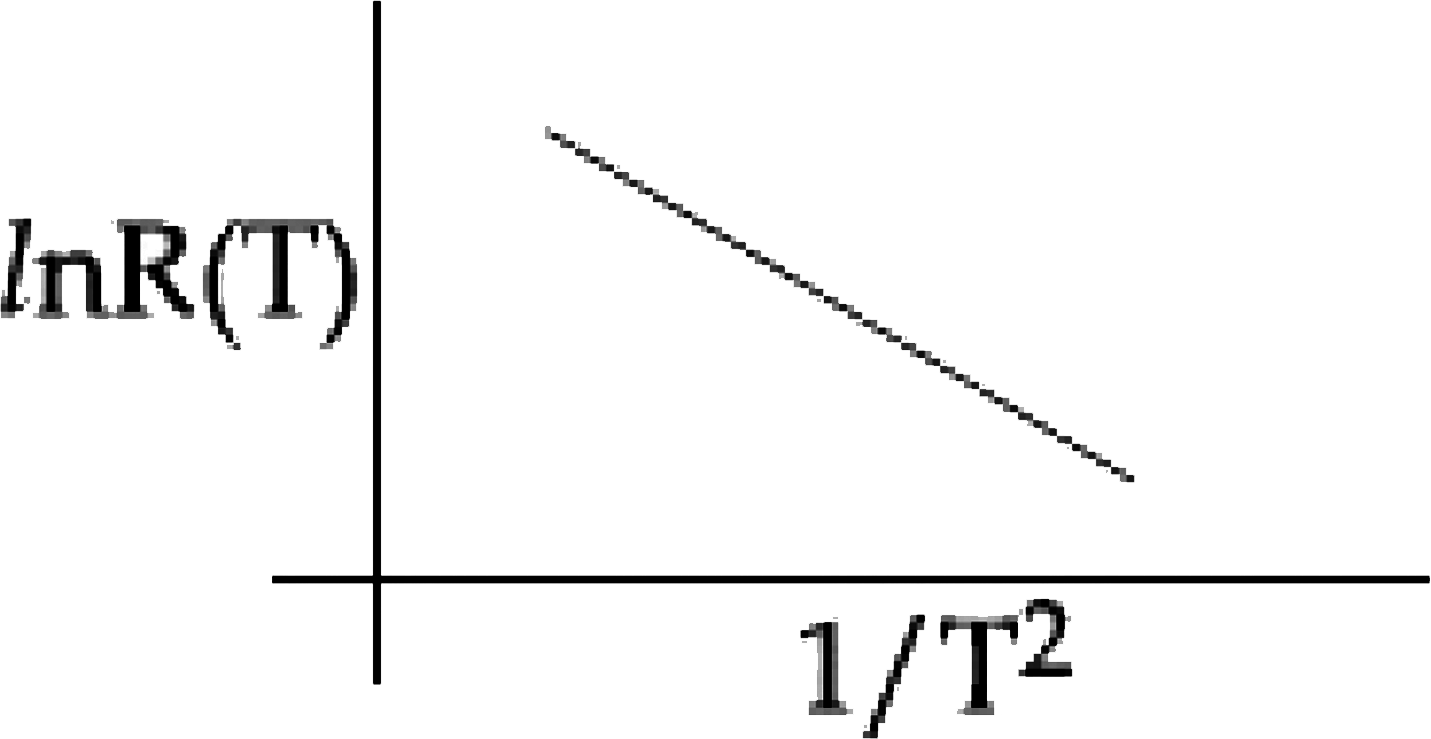
- In an experiment, the resistance of a material is plotted as a functio...
Text Solution
|
- A cylinder witih fixed capacity of 67.2 lit contains helium gas at STP...
Text Solution
|
- A thin disc of mass M and radius R has mass per unit area sigma( r)=kr...
Text Solution
|
- In a photoelectric effect experiment the threshold wavelength of light...
Text Solution
|
- Two radioactive material A and B have decay constants 10 lambda and la...
Text Solution
|
- In the given circuit, an ideal voltmeter connected across the 10 Omega...
Text Solution
|