Home
Class 12
CHEMISTRY
Which of the graphs shown below does not...

Which of the graphs shown below does not represent the relationship between incident light and the electron ejected from metal surface?

A

B

C

D

Text Solution

AI Generated Solution

The correct Answer is:
To solve the question regarding which graph does not represent the relationship between incident light and the electrons ejected from a metal surface, we can follow these steps: ### Step-by-Step Solution: 1. **Understanding the Photoelectric Effect**: - The photoelectric effect describes the phenomenon where electrons are ejected from a metal surface when it is exposed to light of sufficient frequency. The energy of the incident light must exceed a certain threshold energy (E₀) for electrons to be emitted. 2. **Kinetic Energy of Ejected Electrons**: - The kinetic energy (K.E.) of the ejected electrons can be expressed by the equation: \[ K.E. = E - E_0 \] where \(E\) is the energy of the incident light and \(E_0\) is the threshold energy. 3. **Graphical Representation**: - The relationship between the frequency of incident light (ν) and the kinetic energy of the ejected electrons can be represented by the equation: \[ K.E. = hν - hν_0 \] where \(h\) is Planck's constant and \(ν_0\) is the threshold frequency. This implies that: - The slope of the graph of kinetic energy (K.E.) vs. frequency (ν) is \(h\). - The intercept on the K.E. axis is \(-hν_0\). 4. **Analyzing the Given Graphs**: - **Graph 1**: If this graph starts from the origin (0,0) and has an intercept, it does not correctly represent the relationship because the K.E. should not be zero when the frequency is below the threshold frequency. - **Graph 2**: If this graph has a positive slope and a non-zero intercept, it could represent a valid relationship. - **Graph 3**: If this graph plots the number of ejected electrons against frequency, it is also valid. - **Graph 4**: If this graph shows K.E. against intensity, it is incorrect since K.E. does not depend on intensity. 5. **Conclusion**: - Based on the analysis, **Graph 1** does not represent the correct relationship between incident light and the ejected electrons from the metal surface. ### Final Answer: **Graph 1 is the correct answer as it does not represent the relationship between incident light and the electron ejected from the metal surface.**

To solve the question regarding which graph does not represent the relationship between incident light and the electrons ejected from a metal surface, we can follow these steps: ### Step-by-Step Solution: 1. **Understanding the Photoelectric Effect**: - The photoelectric effect describes the phenomenon where electrons are ejected from a metal surface when it is exposed to light of sufficient frequency. The energy of the incident light must exceed a certain threshold energy (E₀) for electrons to be emitted. 2. **Kinetic Energy of Ejected Electrons**: ...
Promotional Banner

Topper's Solved these Questions

  • ATOMIC STRUCTURE

    VMC MODULES ENGLISH|Exercise JEE Advanced (Archive )|67 Videos
  • ATOMIC STRUCTURE

    VMC MODULES ENGLISH|Exercise LEVEL - 2 ( Numerical value type for JEE Main )|16 Videos
  • AMINES

    VMC MODULES ENGLISH|Exercise IN CHAPTER EXERCISE H|10 Videos
  • CHEMICAL BONDING & CHEMICAL STRUCTURE

    VMC MODULES ENGLISH|Exercise IMPECCABLE|50 Videos

Similar Questions

Explore conceptually related problems

Relationship between incident light and CO_2 fixation rate is

Which graph best represent the relationship between conductivity and resistivity for a solid ?

Linear relationship exists between incident light and rate of CO_(2) fixation at/in.

If lamda_o and lamda be the threshold wavelength and wavelength of incident light , the velocity of photoelectron ejected from the metal surface is :

Which of the following graphs represents the relationship between the force F between two point charges and the distance r between them :

The graph shown represents which of the following equations ?

Which of the following equations represents the line shown in the graph?

Assertion : The number of electrons ejected from a metal surface depend upon the frequency of light. Reason : There is a time lag between the striking of light beam and the ejection of electrons from the metal surface.

A metal surface in an evacuated tube is illuminated with monochromatic light causing the emission of photoelectrons. For a given intensity of light, a graph between saturation current and potential of the electrode is given in Fig. If the experiment were repeated with light of twice the intensity but the same wavelength, which of the graphs below would best represent the new relation between I and V?(Dotted represents initial condition)

Which one of the following function best represents the graphs as shown below?

VMC MODULES ENGLISH-ATOMIC STRUCTURE-JEE Main (Archive)
  1. The total number of orbitals associated with the principal quantum num...

    Text Solution

    |

  2. A stream of electrons from a heated filament was passed between two ch...

    Text Solution

    |

  3. The radius of the second Bohr orbit for hydrogen atom is [Planck's con...

    Text Solution

    |

  4. If the shortest wavelength in Lyman series of hydrogen atom is A, then...

    Text Solution

    |

  5. The electron in the hydrogen atom undergoes transition from higher orb...

    Text Solution

    |

  6. Ejection of the photoelectron from metal in the photoelectric effect e...

    Text Solution

    |

  7. The de Broglie's wavelength of electron present in first Bohr orbit of...

    Text Solution

    |

  8. Which of the following statements is false?

    Text Solution

    |

  9. For emission line of atomic hydrogen from n(i)=8 to n(f)=n, the plot o...

    Text Solution

    |

  10. Which of the following combination of statements is true regarding the...

    Text Solution

    |

  11. The ground state energy of hydrogen atom is -13.6 eV. The energy of se...

    Text Solution

    |

  12. Heat treatment of muscular pain involves radiation of wavelength of ab...

    Text Solution

    |

  13. what is the work fuction of the metal if the light of wavelength 4...

    Text Solution

    |

  14. If the de Broglie wavelength of the electron in n^(th) Bohr orbit in a...

    Text Solution

    |

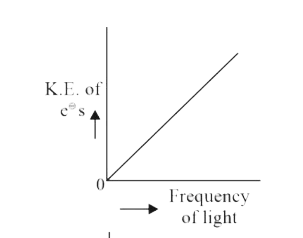
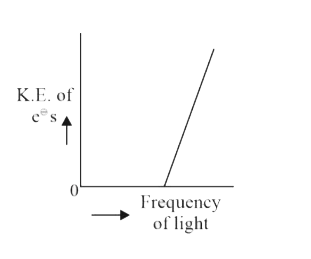
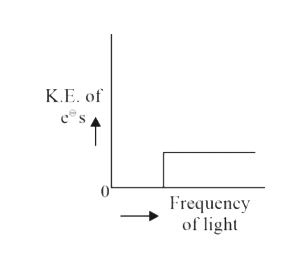
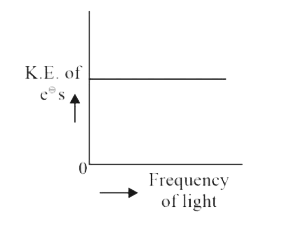
  15. Which of the graphs shown below does not represent the relationship be...

    Text Solution

    |

  16. The de Broglie wavelenght (lambda) associated with a photoelectron var...

    Text Solution

    |

  17. The electrons are more likely to be found:

    Text Solution

    |

  18. In which of the following, energy of 2s orbital is minimum

    Text Solution

    |

  19. Which one of the following about an electron occupying the 1s orbital ...

    Text Solution

    |

  20. If p is the momentum of the fastest electron ejected from a metal surf...

    Text Solution

    |