Home
Class 12
PHYSICS
The stress strain graph for a metal wire...

The stress strain graph for a metal wire is shown in the fig. Up to the point E, the wire returns to its original state O along the curve EPO, when it is gradually unloaded. Point B corresponds to the fracture of the wire.

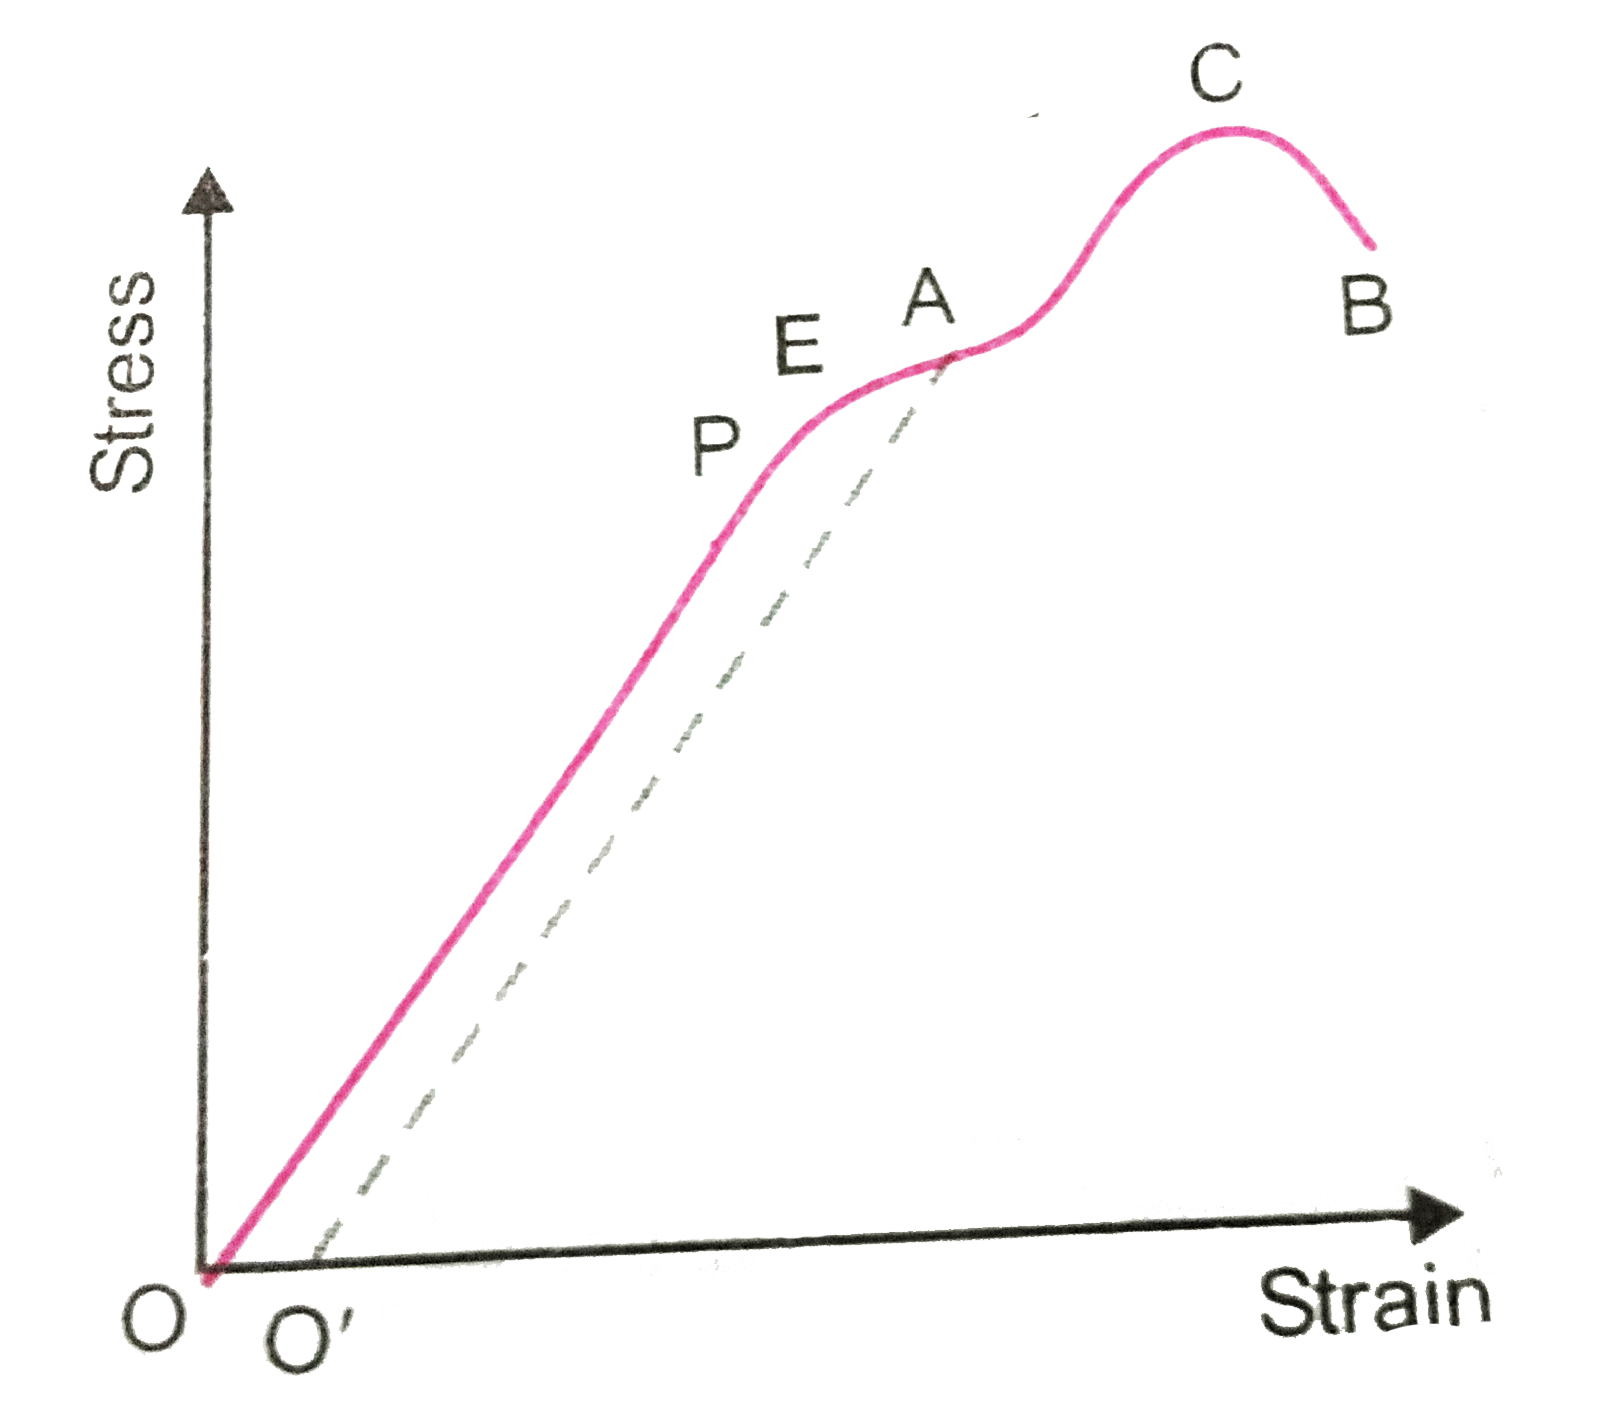
(a) Up to what point on the curve is Hooke's law obeyed? (this point some times called proportional limits).
(b) Which point on the curve corresponding to elastic limit or yield point of the wire?
(c ) Indicate the elastic and plastic regions of the stress-strain graph.
(d) Describe what happens when the wire is loaded up to a stress corresponding to the point A on the graph and then unloaded gradually. In particular explain the dotted curve.
(e) What is peculiar about the portion of the stress- strain graph from C to B? Up to what stress can the wire be subjected without causing fracture?

Text Solution

Verified by Experts

(i) Hooke’s law is obeyed upto the point P, because upto this point, stress `prop` strain .
(ii) Point E corresponds to elastic limit (yield point) because the wire returns to original state O along EPO is it is gradually unloaded.
(iii) The elastic region is from O to E and the plastic region is from E to B.
(iv) Upto point P, stress is proportional to strain. Between P and E strain increases more rapidly than stress and Hooke’s law is not obeyed. When the wire is unloaded at any point A beyond E, the wire does not retrace the curve AEPO but follows the dashed curve AO’. When the stress becomes zero, a residual strain OO’ is left in the wire.
(v) Between C and B, the wire virtually flows out, i.e., the strain increases even the wire is being unloaded.
Promotional Banner

Topper's Solved these Questions

  • PROPERTIES OF MATTER

    VMC MODULES ENGLISH|Exercise Level -1|90 Videos
  • PROPERTIES OF MATTER

    VMC MODULES ENGLISH|Exercise Level -2|50 Videos
  • MOVING CHARGES & MAGNETISM

    VMC MODULES ENGLISH|Exercise IN-CHAPTER EXERCISE-K|10 Videos
  • QUIZ

    VMC MODULES ENGLISH|Exercise PHYSICS|30 Videos

Similar Questions

Explore conceptually related problems

The stress strain graph for a metal wire is as shown in the figure. In the graph, the region in which Hooke's law is obeyed, the ultimate strength and fracture are represented by

The stress-strain graph for a metallic wire is shown at two different temperature, T_(1) and T_(2) which temperature is high T_(1) or T_(2) ?

The fig. shows the v-t graph of a particle moving in straight line. Find the time when particle returns to the starting point.

The strain stress curves of three wires of different materials are shown in the figure. P, Q and R are the elastic limits of the wires. The figure shown that

The stress versus strain graphs for wires of two materials A and B are as shown in the figure. If Y_(A) and Y_(B) are the younng's moduli of the materials, then

The stress versus strain graphs for wires of two materials A and B are as shown in the figure. If Y_(A) and Y_(B) are the younng's moduli of the materials, then

A current I flows along a thin wire shaped as shown in figure. The radius of the curved part of the wire is r. The field at the centre O of the coil is:

For the shown graph slope of graph from point A to point B :

Show that the slope of adiabatic curve at any point is Yama times the slope of an isothermal curve at the corresponding point.

Assertion:- Materials can be stretched even beyond proportionality limit. (point till which Hooke's law is valid is called proportionality limit) Reason:- Elastic forces can be conservative even beyond proportional limit.