Home
Class 7
MATHS
Age (in years) of 6 children of two grou...

Age (in years) of 6 children of two groups are recorded as below:

(a) Find the mode and range for each group.
(b) Find the range and mode if the two groups are combined together

Promotional Banner

Topper's Solved these Questions

  • DATA HANDLING

    NCERT EXEMPLAR|Exercise THINK AND DISCUSS |3 Videos
  • DATA HANDLING

    NCERT EXEMPLAR|Exercise EXERCISE(TRUE OR FALSE)|18 Videos
  • COMPARING QUANTITIES

    NCERT EXEMPLAR|Exercise THINK AND DISCUSS|24 Videos
  • EXPONENTS AND POWERS

    NCERT EXEMPLAR|Exercise EXERCISE|136 Videos

Similar Questions

Explore conceptually related problems

The ages of 40 students of a group are given below : Find their mean

The average age of group of 20 girls is 15 yr and that of another group of 25 boys is 24 yr. The average ageof the two groups mixed together is

Find the mode of following destribution by Grouping

How many children are there in the group ? (i) Average age of the children in this group is 15 years. The total ages of all the children in this group is 240 years. (ii) The total age of all the children in the group and the teacher is 264 years. The age of the teacher is 9 years more than average age of the children.

Average age of a group of 30 boys is 16 years. A boy of age 19 leaves the group and a new boy joins the group. If the new average age of the group is 15.8 years, find the age of the new boy.

If the combined mean of two groups is (40)/(3) and if the mean of one group with 10 observations is 15 then the mean of the other group with 8 observations is equal to

Two-thirds of children are in the age group 1-12 yr. Of this, if three-fourths are in the age group of 1-8 yr. Find the fraction of children in the age group of 9-12 yr?

NCERT EXEMPLAR-DATA HANDLING-EXERCISE
  1. Given below are heights of 15 boys of a class measured in cm: 128, 1...

    Text Solution

    |

  2. Observe the data and answer the questions that follow: 16, 15, 16, 16...

    Text Solution

    |

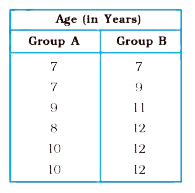
  3. Age (in years) of 6 children of two groups are recorded as below: ...

    Text Solution

    |

  4. Observe the given bar graph carefully and answer the questions that fo...

    Text Solution

    |

  5. The bar graph given below shows the marks of students of a class in a ...

    Text Solution

    |

  6. Study the bar graph given below and answer the questions that follow. ...

    Text Solution

    |

  7. Study the bar graph given below and answer the questions that follow ...

    Text Solution

    |

  8. The bar graph given below represents the circulation of newspapers (da...

    Text Solution

    |

  9. Study the double bar graphs given belwo and answer the following ques...

    Text Solution

    |

  10. Study the double bar graph shown below and answer the questions that f...

    Text Solution

    |

  11. Study the double bar graph given below and answer the questions that f...

    Text Solution

    |

  12. The following table shows the average intake of nutrients in calories ...

    Text Solution

    |

  13. Study the double bar graph and answer the quesions that follow: ...

    Text Solution

    |

  14. In a public library, the following observations were recorded by the l...

    Text Solution

    |

  15. Observe the following data: (a) Draw a double bar graph choosing ...

    Text Solution

    |

  16. Observe the given data: (a) Draw a bar graph to represent the abo...

    Text Solution

    |

  17. Below is a list of 10 tallest buildings in India. This list ranks bu...

    Text Solution

    |

  18. The marks out of 100 obtained by Kunal and Soni in the Half Yearly Exa...

    Text Solution

    |

  19. The students of Class VII have to choose one club from Music, Dance, Y...

    Text Solution

    |

  20. The data given below shows the production of motor bikes in a factory ...

    Text Solution

    |