Home
Class 7
MATHS
Below is a list of 10 tallest buildings ...

Below is a list of 10 tallest buildings in India.
This list ranks buildings in India that stand at least 150m (492 ft.) tall, based on standard height measurement. This includes spires and architectural details but does not include antenna marks. Following data is given as per the available information till 2009. Since new buildings are always under construction, go on-line to check new taller buildings.
Use the information given in the table about sky scrapers to answer the following questions:

(a) Find the height of each storey of the three tallest buildings and write them in the following table:

(b) The average height of one storey for the buildings given in (a) is
(c) Which city in this list has the largest percentage of skyscrappers? What is the percentage?
(d) What is the range of data?
(e) Find the median of the data.
(f) Draw a bar graph for given data.

Promotional Banner

Topper's Solved these Questions

  • DATA HANDLING

    NCERT EXEMPLAR|Exercise THINK AND DISCUSS |3 Videos
  • DATA HANDLING

    NCERT EXEMPLAR|Exercise EXERCISE(TRUE OR FALSE)|18 Videos
  • COMPARING QUANTITIES

    NCERT EXEMPLAR|Exercise THINK AND DISCUSS|24 Videos
  • EXPONENTS AND POWERS

    NCERT EXEMPLAR|Exercise EXERCISE|136 Videos

Similar Questions

Explore conceptually related problems

Why does lightning usually strike tall buildings ?

If the angles of depression of the top and bottom of a short building from the top of a tall building are 30^(@) and 60^(@) respectively,then the ratio of the heights of short and tall building is

A building is in the form of a cylinder surmounted by a hemispherical dome on the diameter of the cylinder. The height of the building is three times the radius of the base of the cylinder. The building contains 67 (1/21) m^(3) of air. What is the height of the building ?

They told me that they had build a new house.

NCERT EXEMPLAR-DATA HANDLING-EXERCISE
  1. Observe the given bar graph carefully and answer the questions that fo...

    Text Solution

    |

  2. The bar graph given below shows the marks of students of a class in a ...

    Text Solution

    |

  3. Study the bar graph given below and answer the questions that follow. ...

    Text Solution

    |

  4. Study the bar graph given below and answer the questions that follow ...

    Text Solution

    |

  5. The bar graph given below represents the circulation of newspapers (da...

    Text Solution

    |

  6. Study the double bar graphs given belwo and answer the following ques...

    Text Solution

    |

  7. Study the double bar graph shown below and answer the questions that f...

    Text Solution

    |

  8. Study the double bar graph given below and answer the questions that f...

    Text Solution

    |

  9. The following table shows the average intake of nutrients in calories ...

    Text Solution

    |

  10. Study the double bar graph and answer the quesions that follow: ...

    Text Solution

    |

  11. In a public library, the following observations were recorded by the l...

    Text Solution

    |

  12. Observe the following data: (a) Draw a double bar graph choosing ...

    Text Solution

    |

  13. Observe the given data: (a) Draw a bar graph to represent the abo...

    Text Solution

    |

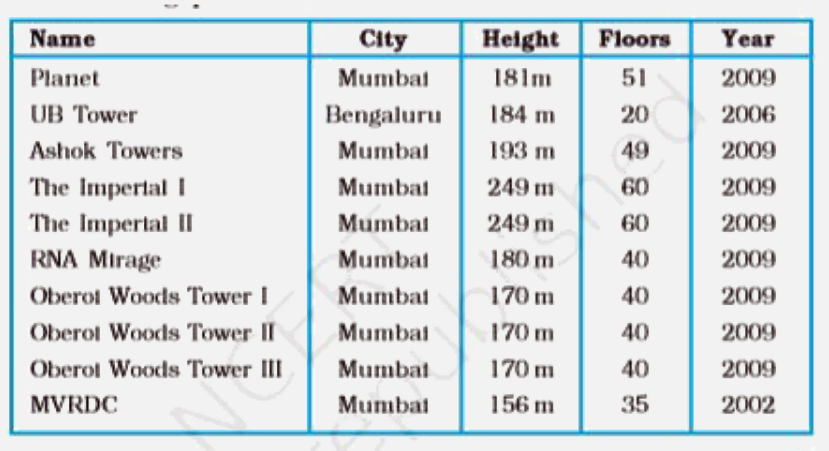
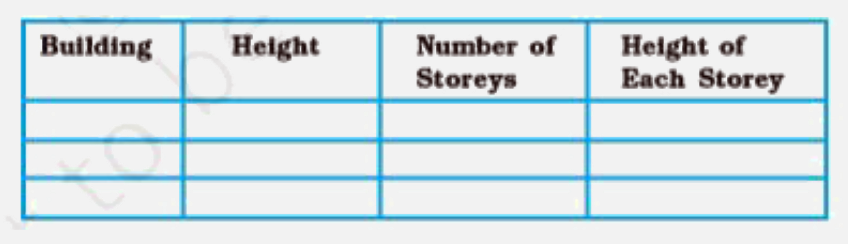
  14. Below is a list of 10 tallest buildings in India. This list ranks bu...

    Text Solution

    |

  15. The marks out of 100 obtained by Kunal and Soni in the Half Yearly Exa...

    Text Solution

    |

  16. The students of Class VII have to choose one club from Music, Dance, Y...

    Text Solution

    |

  17. The data given below shows the production of motor bikes in a factory ...

    Text Solution

    |

  18. The table below compares the population (in hundreds) of 4 towns over ...

    Text Solution

    |

  19. The table below gives the data of tourists visiting 5 hill stations ov...

    Text Solution

    |

  20. The table below gives the flavours of ice cream liked by children (boy...

    Text Solution

    |