


MBD-DATA HANDLING-EXERCISE
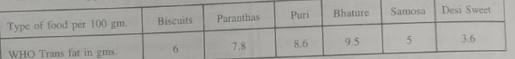
- Draw an appropriate graph to represent the given information.
Text Solution
|
- The scores (out of 100) obtained by 33 students in a Mathematics test ...
Text Solution
|
- In a study of numer of road accidents in a city, the observations for ...
Text Solution
|
- Pulse rate (per miute) of 30 persons were recorded as 61,76,72,73,71,...
Text Solution
|
- The ages of 25 teachers of a school is shown through the given graph ...
Text Solution
|
- The ages of 25 teachers of a school is shown through the given graph ...
Text Solution
|
- The favourite flavours in ice-creams of the studentts in a school in p...
Text Solution
|
- On a particular day,the sales (in rupees) of different items of a bake...
Text Solution
|
- Adjoining pie chart gives the expenditure (in percentage) on various i...
Text Solution
|
- Expenditure on which item is equal to the total savings of the family...
Text Solution
|
- If the monthly savings of the family is Rs.3,000.What is the monthly e...
Text Solution
|
- Two dice are thrown,find the probability of getting sum as 3.
Text Solution
|
- Three coins are tossed. Find the probability of getting : all heads
Text Solution
|
- Findthe probability of getting king card when a card is drawn frm well...
Text Solution
|
- If a bag has 4 red balls and 2 yellow balls, whatis the probability of...
Text Solution
|
- A bag has 4 red balls and 2 yellow balls. (The balls are identical in ...
Text Solution
|