A
B
C
D
Text Solution
Verified by Experts
The correct Answer is:


Topper's Solved these Questions
Similar Questions
Explore conceptually related problems
PEARSON IIT JEE FOUNDATION-KINEMATICS-ASSESSMENT TEST (TEST 2 (SELECT THE CORRECT ALTERNATIVE)
- Choose the correct statement.
Text Solution
|
- Choose the correct statement.
Text Solution
|
- Assertion (A): Quartz clocks are more accurate than pendulum clocks. ...
Text Solution
|
- Assertion (A): The acceleration of a body moving with constant velocit...
Text Solution
|
- The time period of a simple pendulum is 4 s and the acceleration due t...
Text Solution
|
- A car starts from and attains a velocity of 54 km h^(-1) if the accel...
Text Solution
|
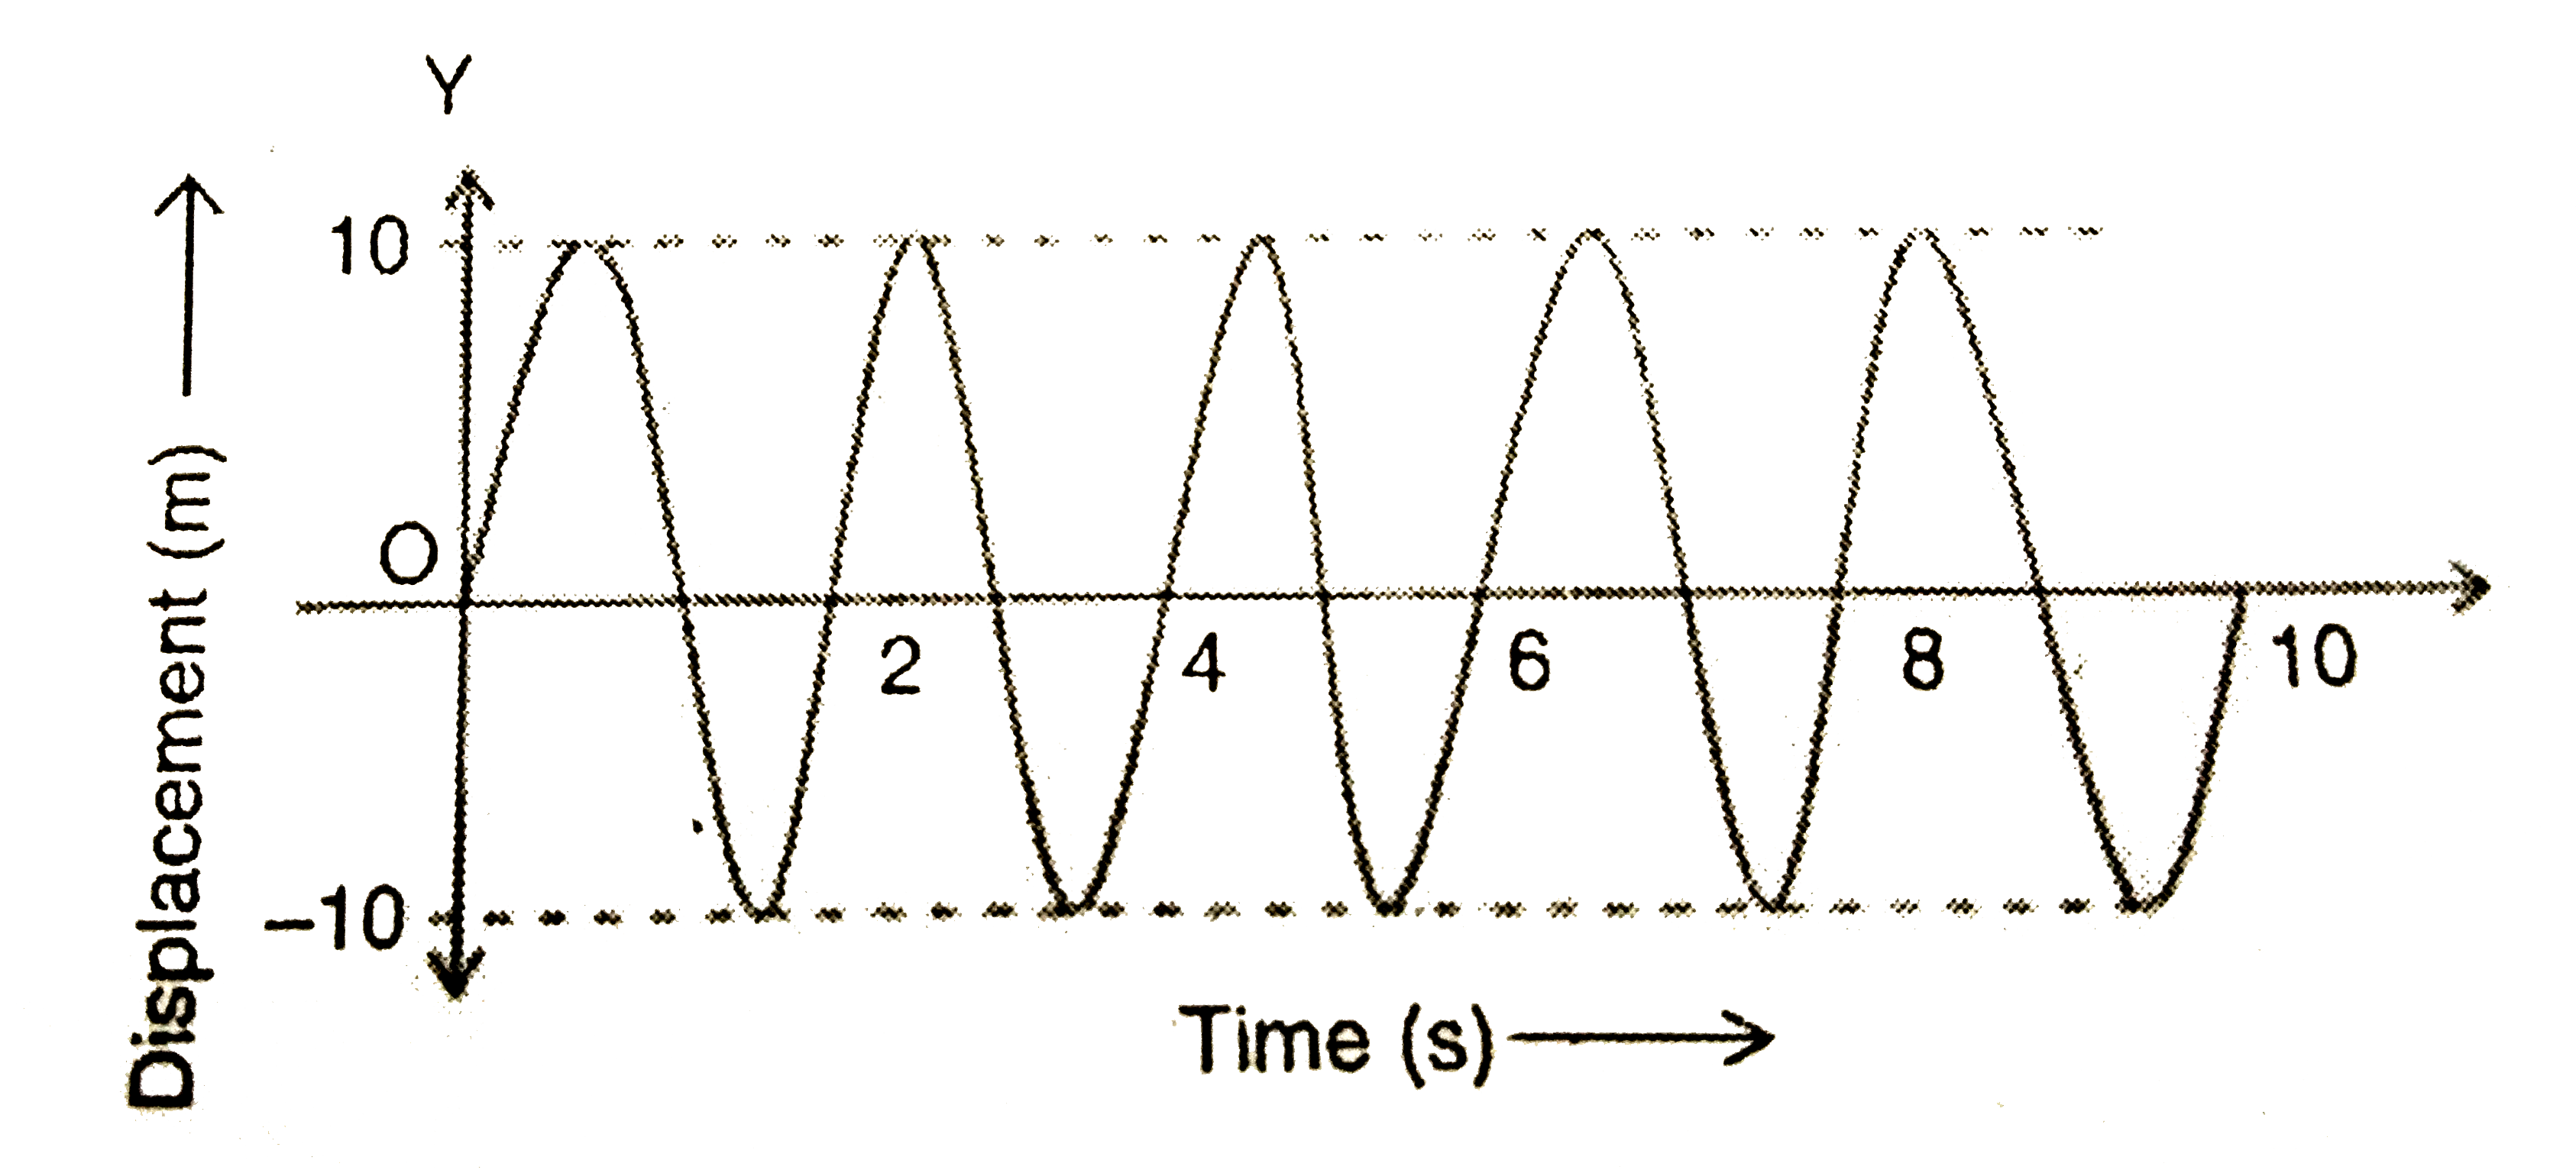
- A graph is drawn between the displacement and time taken for the oscil...
Text Solution
|
- A graph is drawn between the displacement and time taken for the oscil...
Text Solution
|
- A graph is drawn between the displacement and time taken for the oscil...
Text Solution
|
- An electric motor winds 200 turns of a thin coper wire on a unifrom of...
Text Solution
|
- An ant moves along the identical steps from P to Q as shown in the fig...
Text Solution
|
- T=2pisqrt(l/g) is the time period of a simple pendulum, then the unit ...
Text Solution
|
- The motion of a body is depicted graphically as shown in the given fig...
Text Solution
|
- A vechicle travels along a straight path between two places alpha and ...
Text Solution
|
Text Solution
|