Text Solution
Verified by Experts
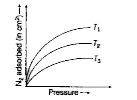
 Condensation Gas adsorbed on solid + Heat By applying Le-Chatelier.s principle, it can be seen that increase of temperature decreases adsorption and vice-versa. The increasing order of temperature is `T_1 lt T_2 lt T_3`


Topper's Solved these Questions
SURFACE CHEMISTRY
ARIHANT PUBLICATION|Exercise PART-I QUESTIONS FOR PRACTICE (MULTIPLE CHOICE TYPE QUESTIONS)|5 VideosSURFACE CHEMISTRY
ARIHANT PUBLICATION|Exercise PART-I QUESTIONS FOR PRACTICE (VERY SHORT ANSWER TYPE QUESTIONS)|14 VideosSAMPLE PAPER 5
ARIHANT PUBLICATION|Exercise GROUP C |7 VideosTHE SOLID STATE
ARIHANT PUBLICATION|Exercise CHAPTER PRACTICE (Long Answer Type Questions)|2 Videos
Similar Questions
Explore conceptually related problems