Home
Class 12
MATHS
The figure shows the graphs of f, f' and...

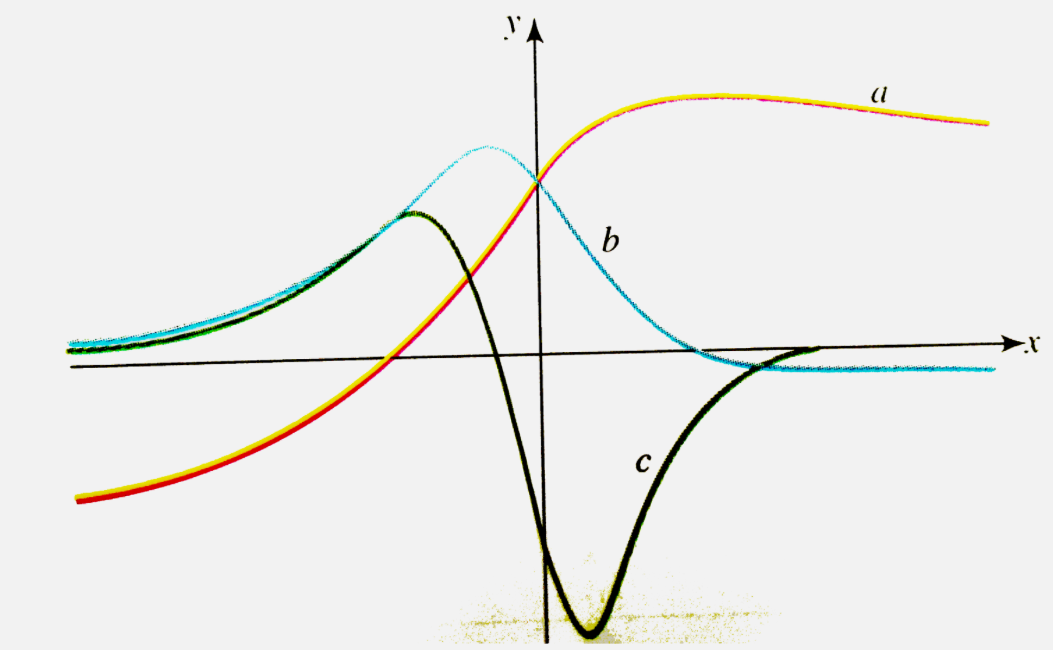
The figure shows the graphs of f, f' and f''. Indentify each curve and explain your choices.

Text Solution

Verified by Experts

Draw the line x = p meeting graph 'b' at its point of maxima, where the derivative is zero.
` (##CEN_GRA_C01_E01_016_S01.png" width="80%">
Thus, graph 'c' is the graph of the derivative of 'b'.
Also, line x = q meets graph 'a' at its point of maxima, where the derivative is zero.
Thus, 'b' is the graph of the derivative of 'a'.
Thus, 'a', 'b', 'c' are the graphs of ` y = f(x), y = f'(x) and y = f''(x)`, respectively.
Doubtnut Promotions Banner Mobile Dark
|

Topper's Solved these Questions

  • GETTING STARTED WITH GRAPHS

    CENGAGE PUBLICATION|Exercise Exercises 1.17|1 Videos
  • GETTING STARTED WITH GRAPHS

    CENGAGE PUBLICATION|Exercise Exercises 1.18|1 Videos
  • GETTING STARTED WITH GRAPHS

    CENGAGE PUBLICATION|Exercise Exercises 1.15|1 Videos
  • FUNCTIONS

    CENGAGE PUBLICATION|Exercise Comprehension Type|7 Videos
  • GRAPH OF INVERSE TRIGONOMETRIC FUNCTIONS

    CENGAGE PUBLICATION|Exercise Exercises|18 Videos

Similar Questions

Explore conceptually related problems
Draw the graph of f(x) = x|x| .

Draw the graph of f(x) = e^(sin x).

Draw the graph of f(x) = sqrt(sin x) .

Draw the graph of the function, f(x) = tan x.

The following figure shows the graph of f(x) =ax^(2)+bx +c , then find the sign of values of a, b and c .

The following figure shows the graph of f(x)= ax^(2)+ bx+c , find the signs of a, b and c .

Draw the graph of the function: f(x)=tanx

The figure illustrates the graph of the function y=f(x) defined in [-3, 2]. Identify the correct statement(s)?

Draw the graphs of the constant functions : f(x) = 0

Draw the graph of the function, f(x)=x^2 .