Text Solution
Verified by Experts


Topper's Solved these Questions
Similar Questions
Explore conceptually related problems
CENGAGE PUBLICATION-CURVE TRACING-EXERCISES
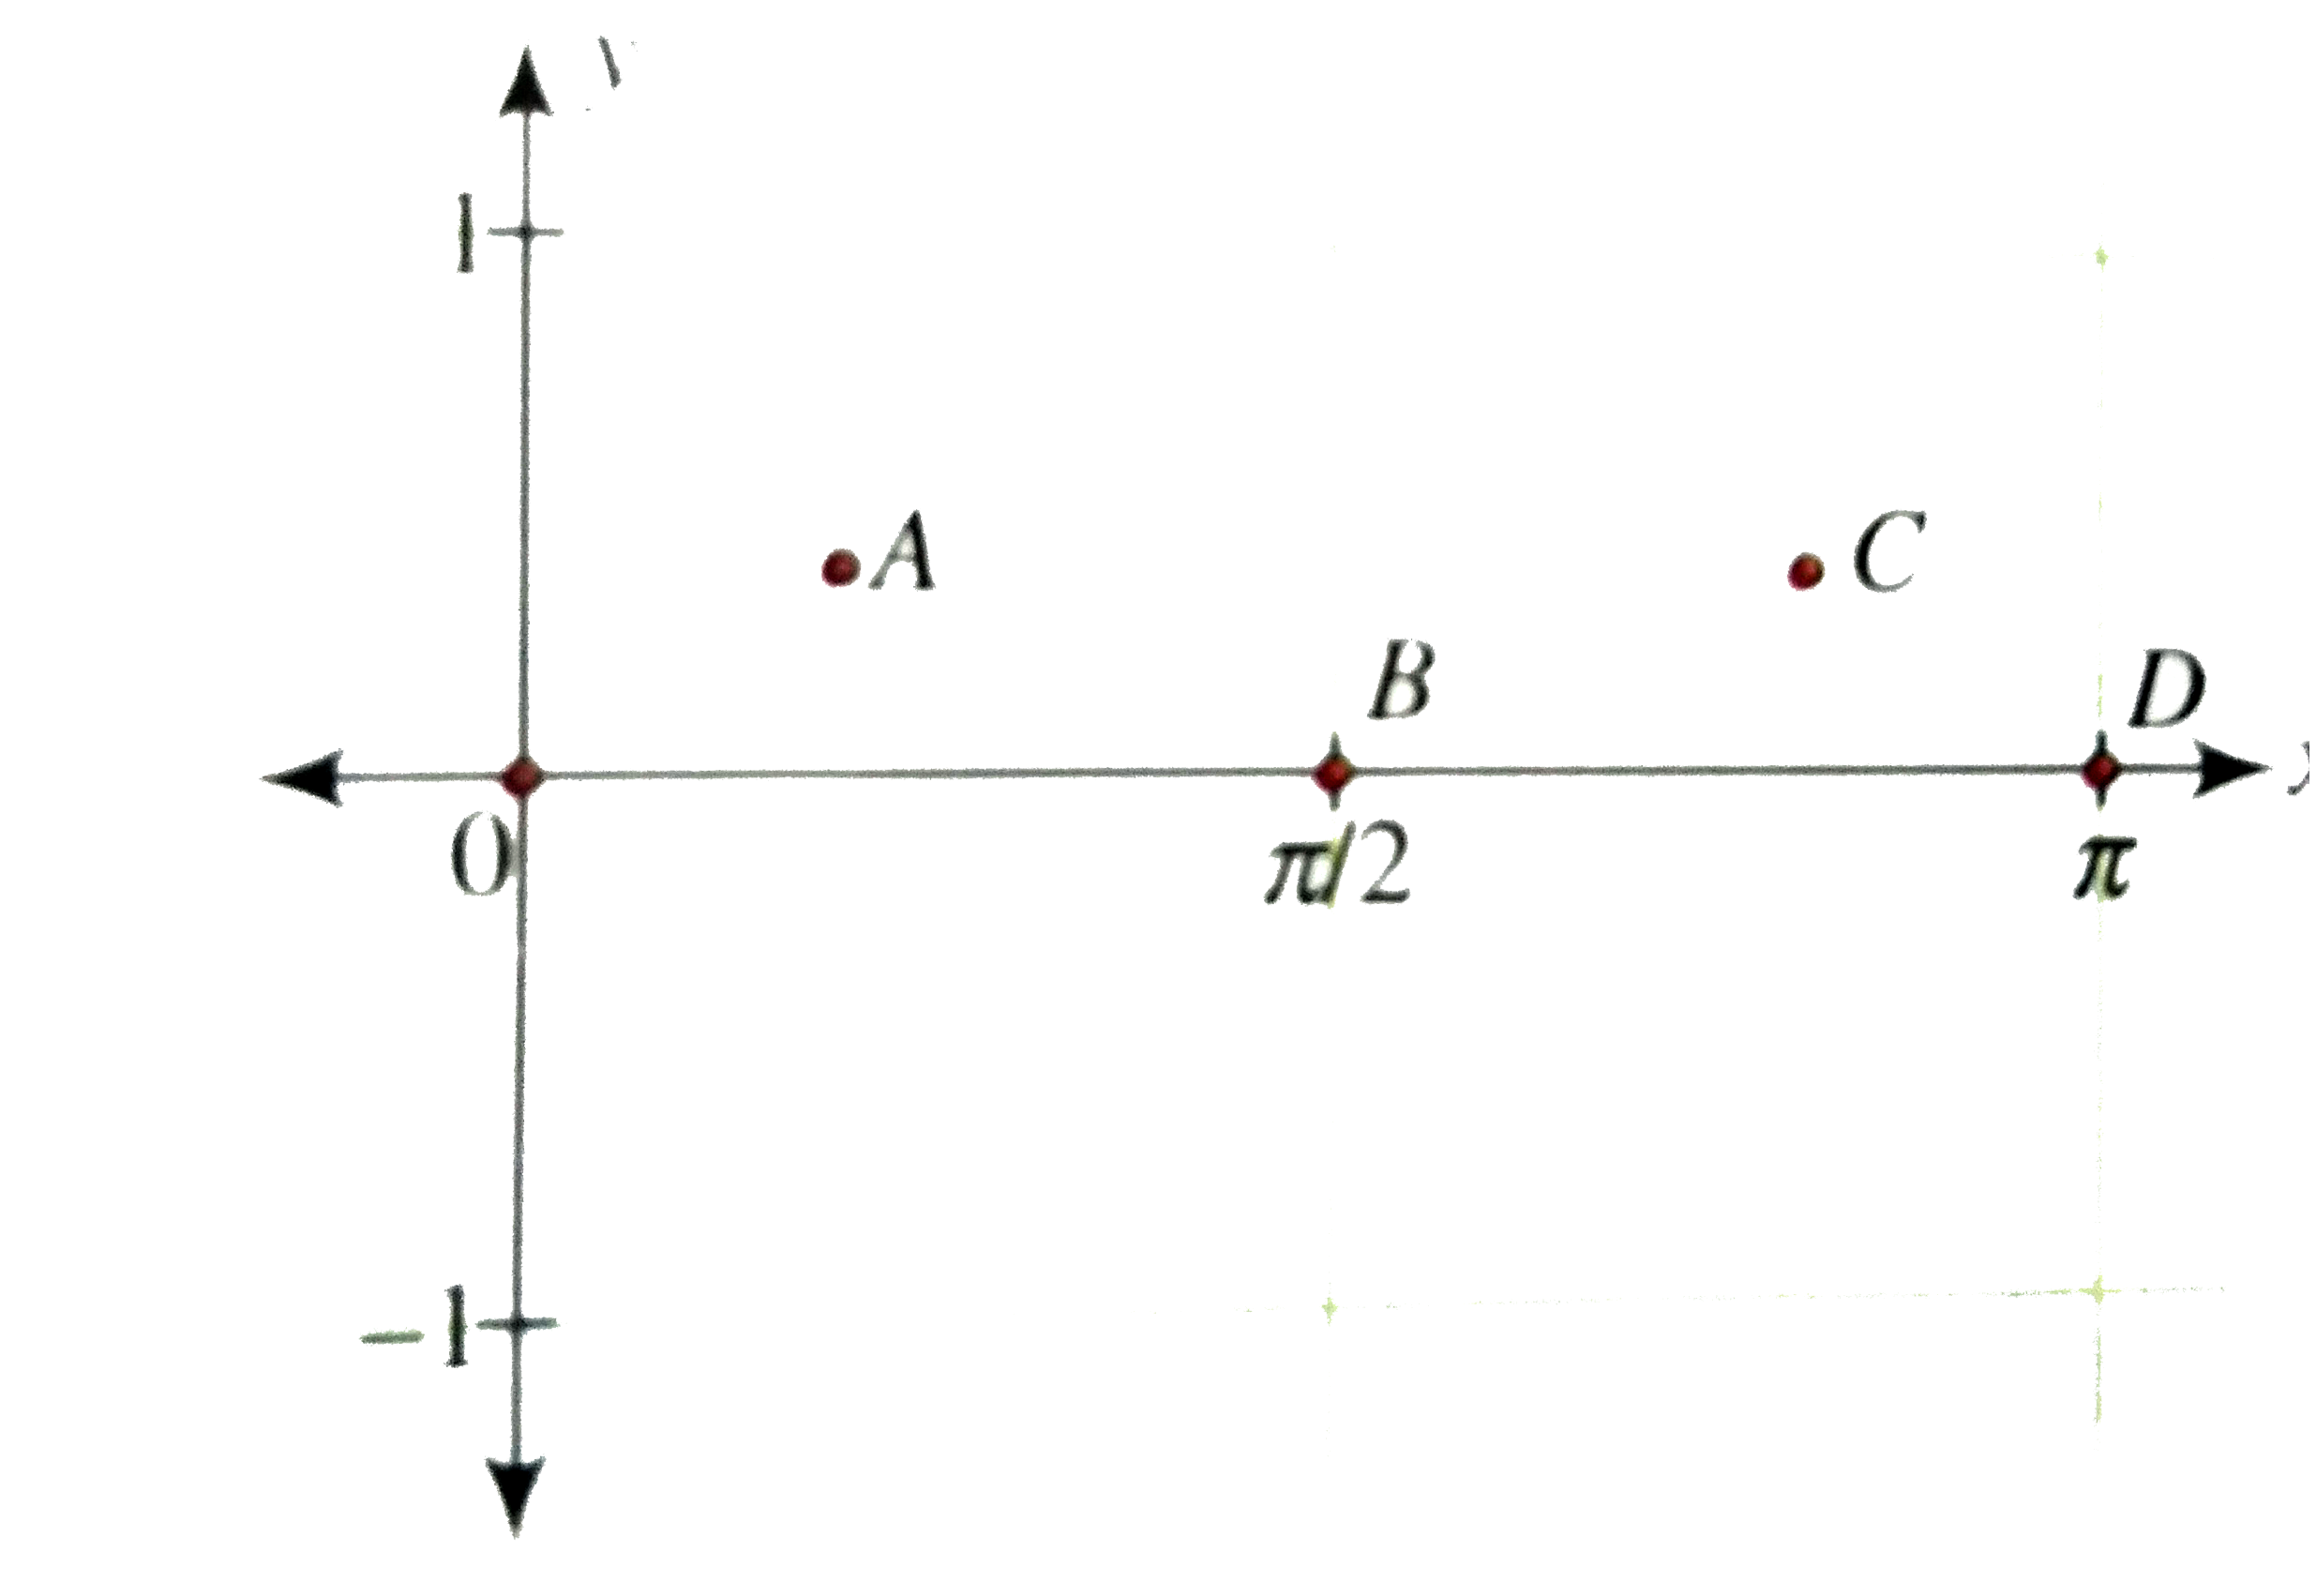
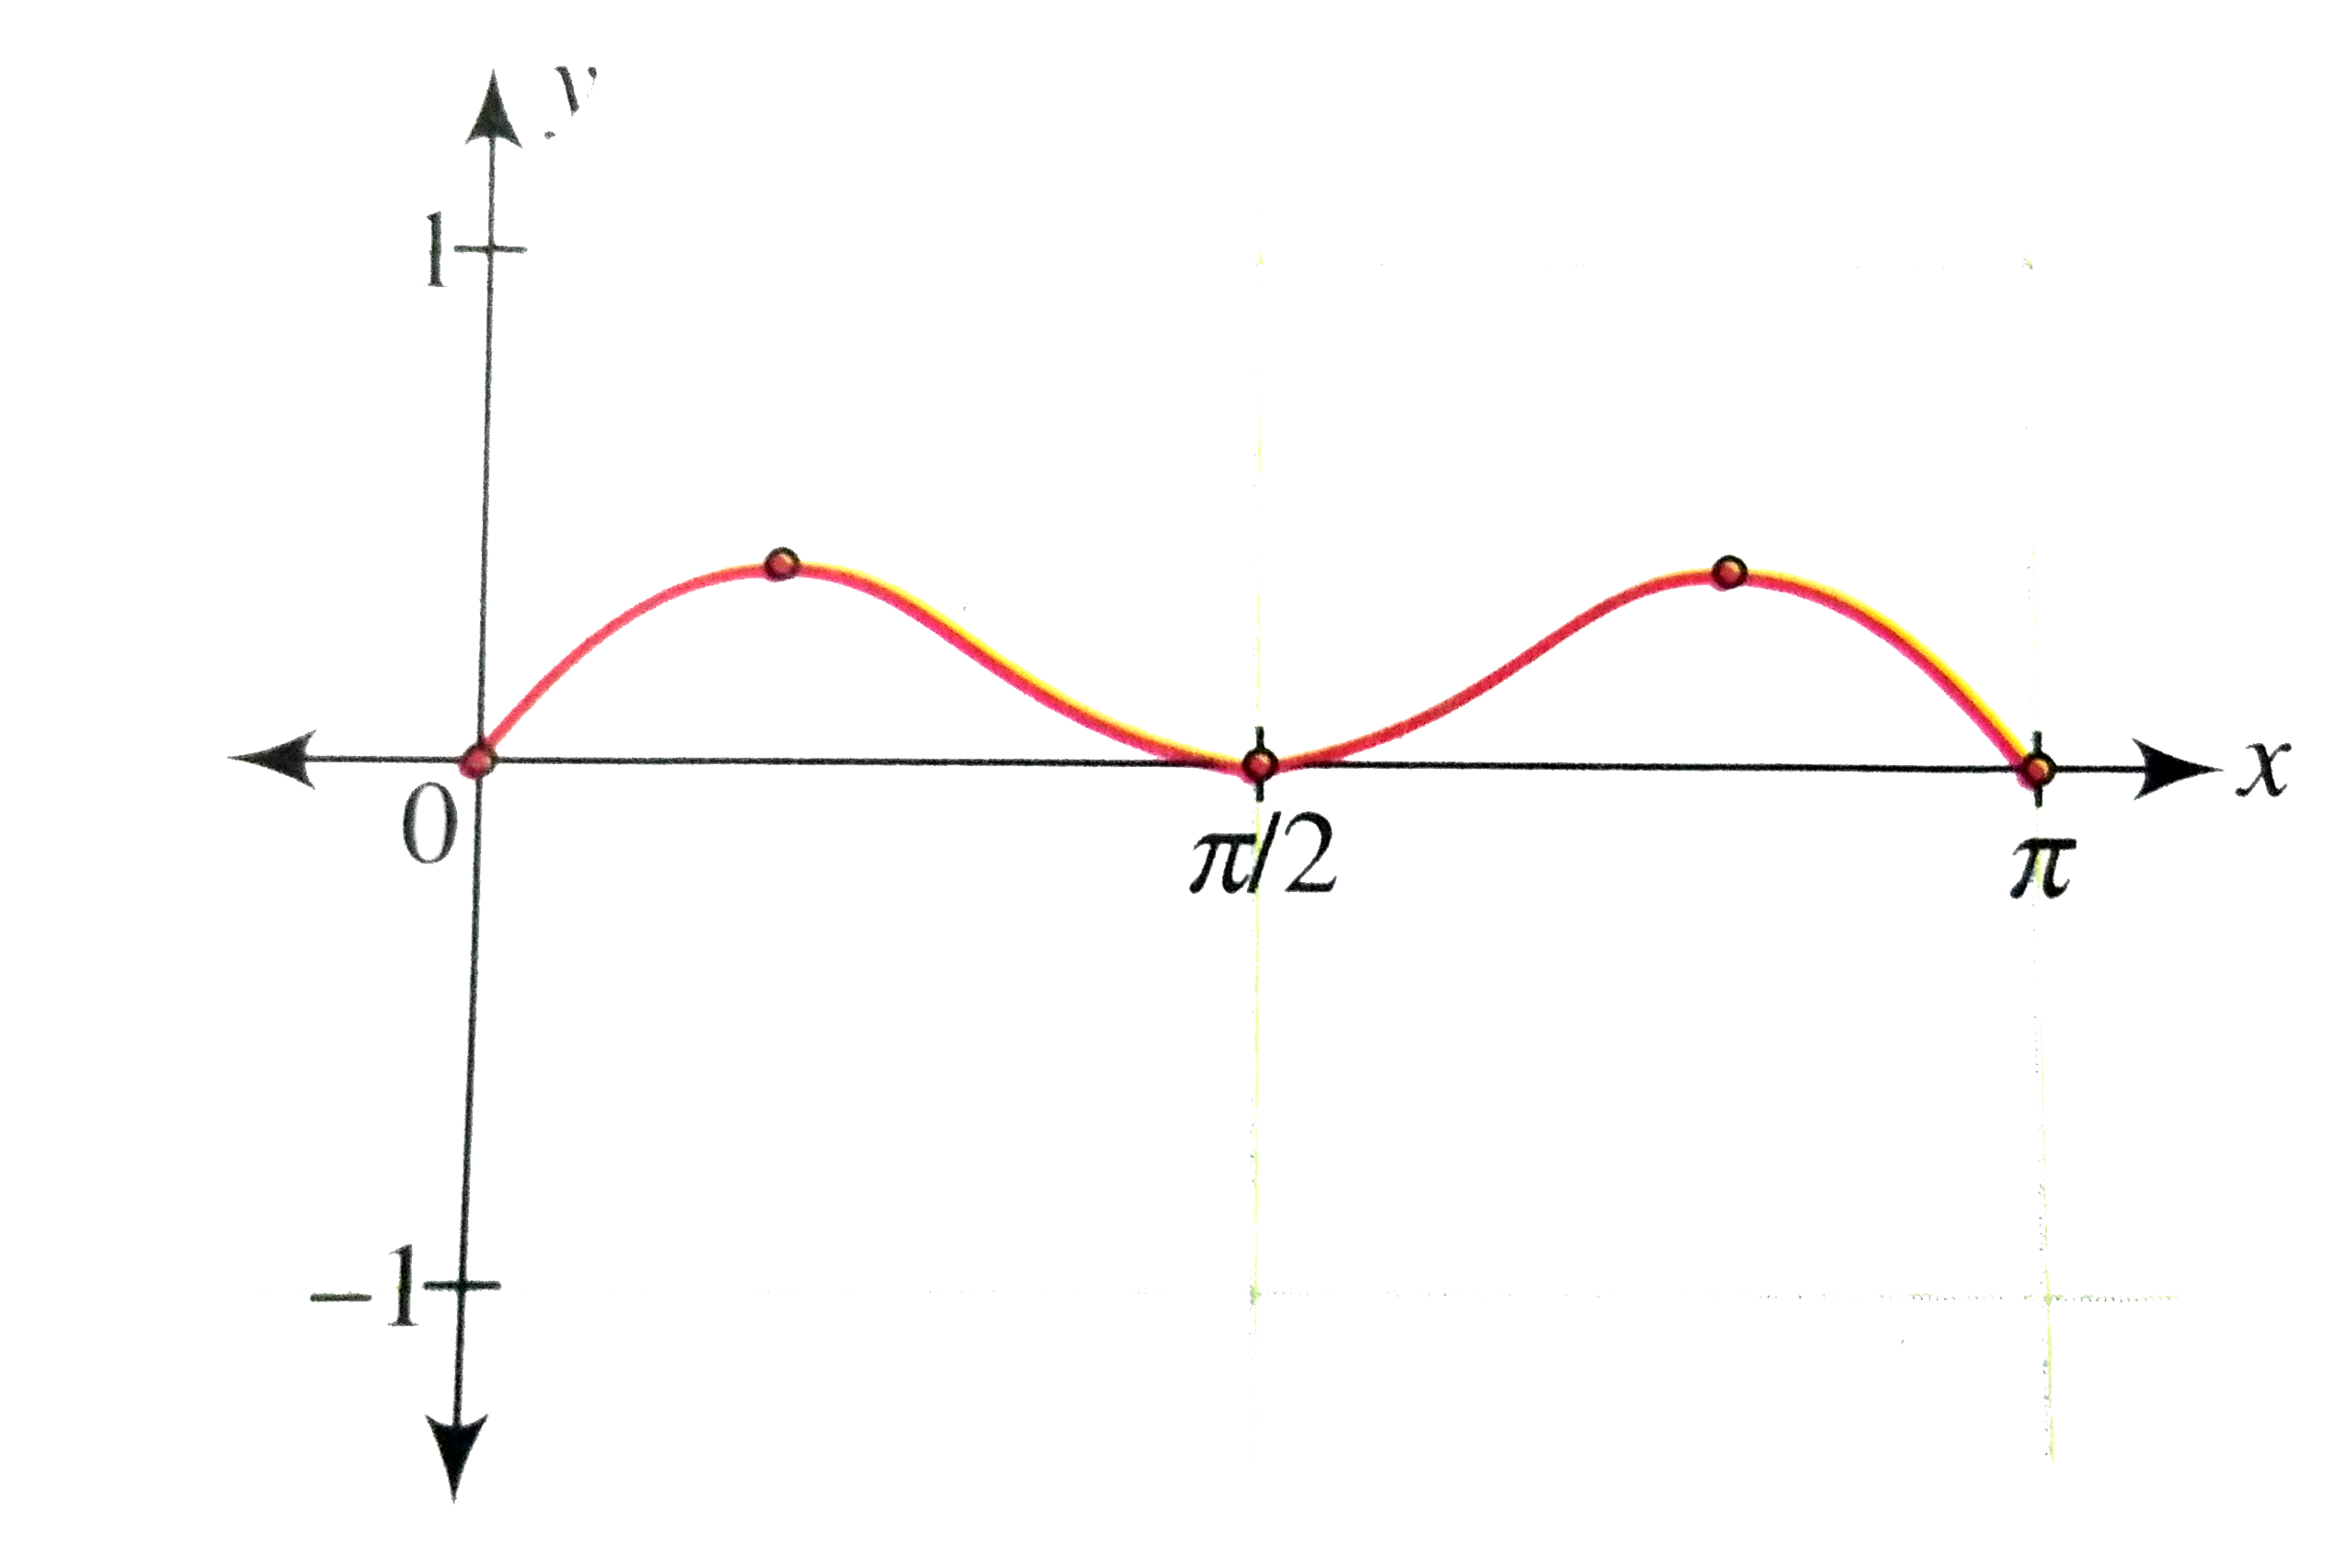
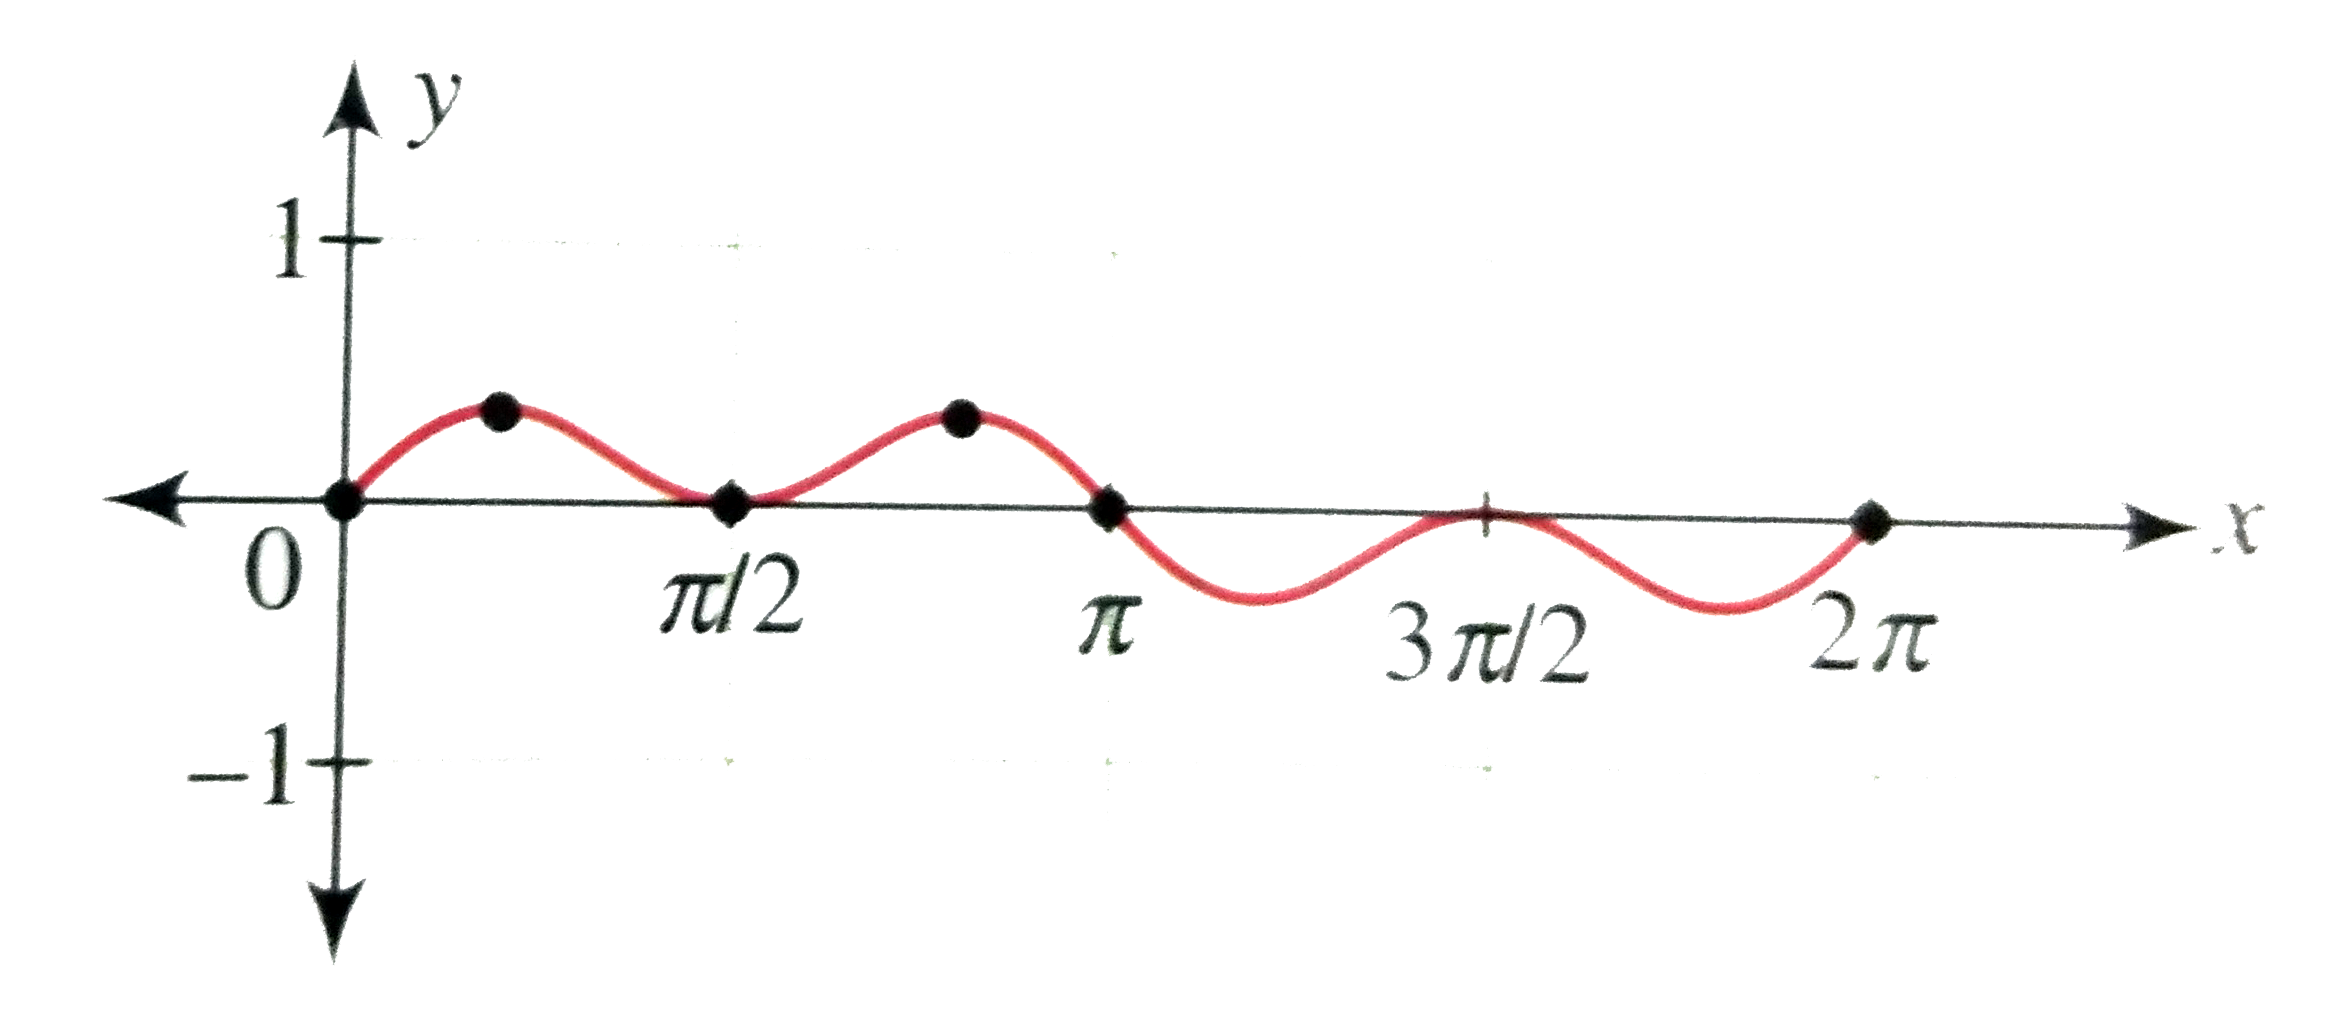
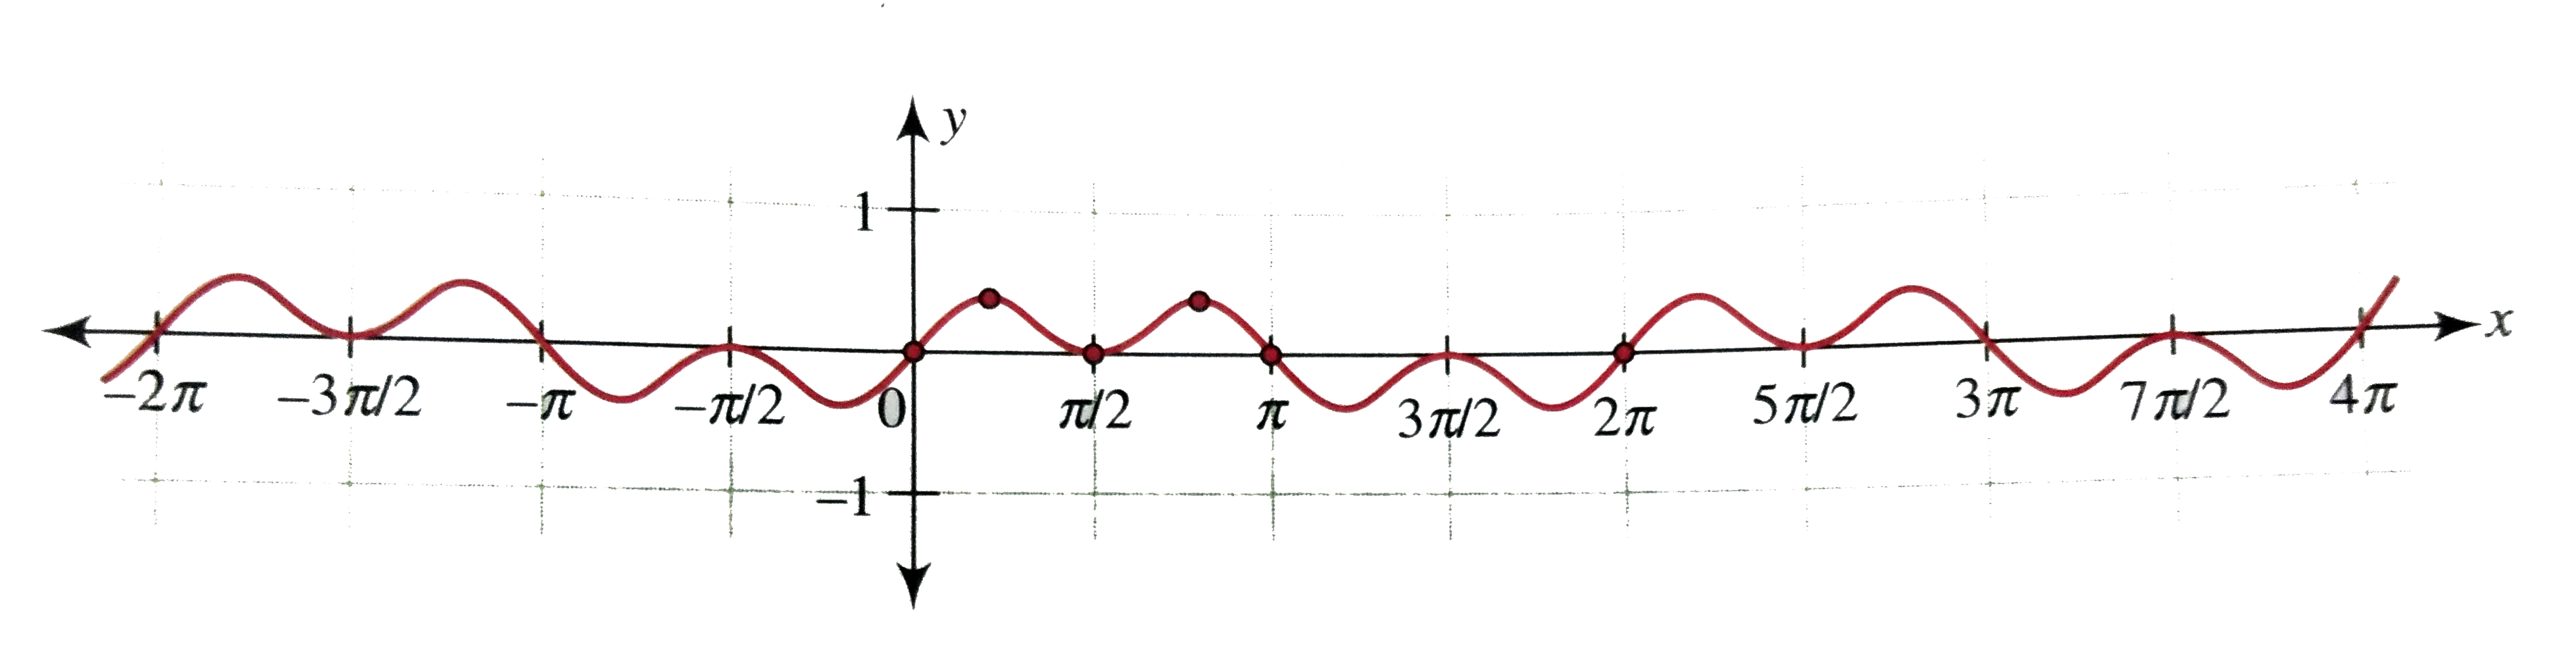
- Draw the graph of y=sinxcos^(2)x
Text Solution
|
- Find the derivative of y=sin^(2)x-cosx
Text Solution
|
- Draw and discuss the graph of f(x) = x+sqrt(x-1)
Text Solution
|
- Draw the graph of y=sqrt(1+x^(2))-x
Text Solution
|
- Draw the graph of y= -sqrt (6-3x^(2))
Text Solution
|
- Draw the graph of y=sqrt(x)/(x-1)
Text Solution
|
- Draw the graph of y=x+(1)/(x).
Text Solution
|
- Draw the graph of y=sqrt((1-x)/(1+x)).
Text Solution
|
- Draw the graph of sqrt(|x|) + sqrt(|y|)=1
Text Solution
|
- Draw the graph of y=sqrt(1+x^(2))-x
Text Solution
|
- Draw and discuss the graph of the function f(x) = e^(1//x)
Text Solution
|
- Draw the graph of y=1/(log(e)x)
Text Solution
|
- Draw the graph of y=1/(log(e)x)
Text Solution
|
- Draw the graph of f(x)=e^(-x^(2)). Discuss the concavity of the graph.
Text Solution
|
- Draw the graph of f(x) = e^(x)/(1+e^(x)). Also find the point of infle...
Text Solution
|
- Draw the graph of the function f(x)=x^(x)
Text Solution
|
- Draw the graph of y=x//"ln "x
Text Solution
|
- Draw the graph of y=(log(e)x)^(2)
Text Solution
|
- Draw the graph of y=log(e)(x^(2)-1)
Text Solution
|
- Draw and graph of f(x) = (4log(e)x)/(x^(2)). Also find the range.
Text Solution
|
- Draw the graph of the relation y^(2)=x^(2)(1-x)
Text Solution
|