A
B
C
D
Text Solution
Verified by Experts
The correct Answer is:


Topper's Solved these Questions
Similar Questions
Explore conceptually related problems
S CHAND IIT JEE FOUNDATION-DATA HANDLING -Self Assessment Sheet - 27
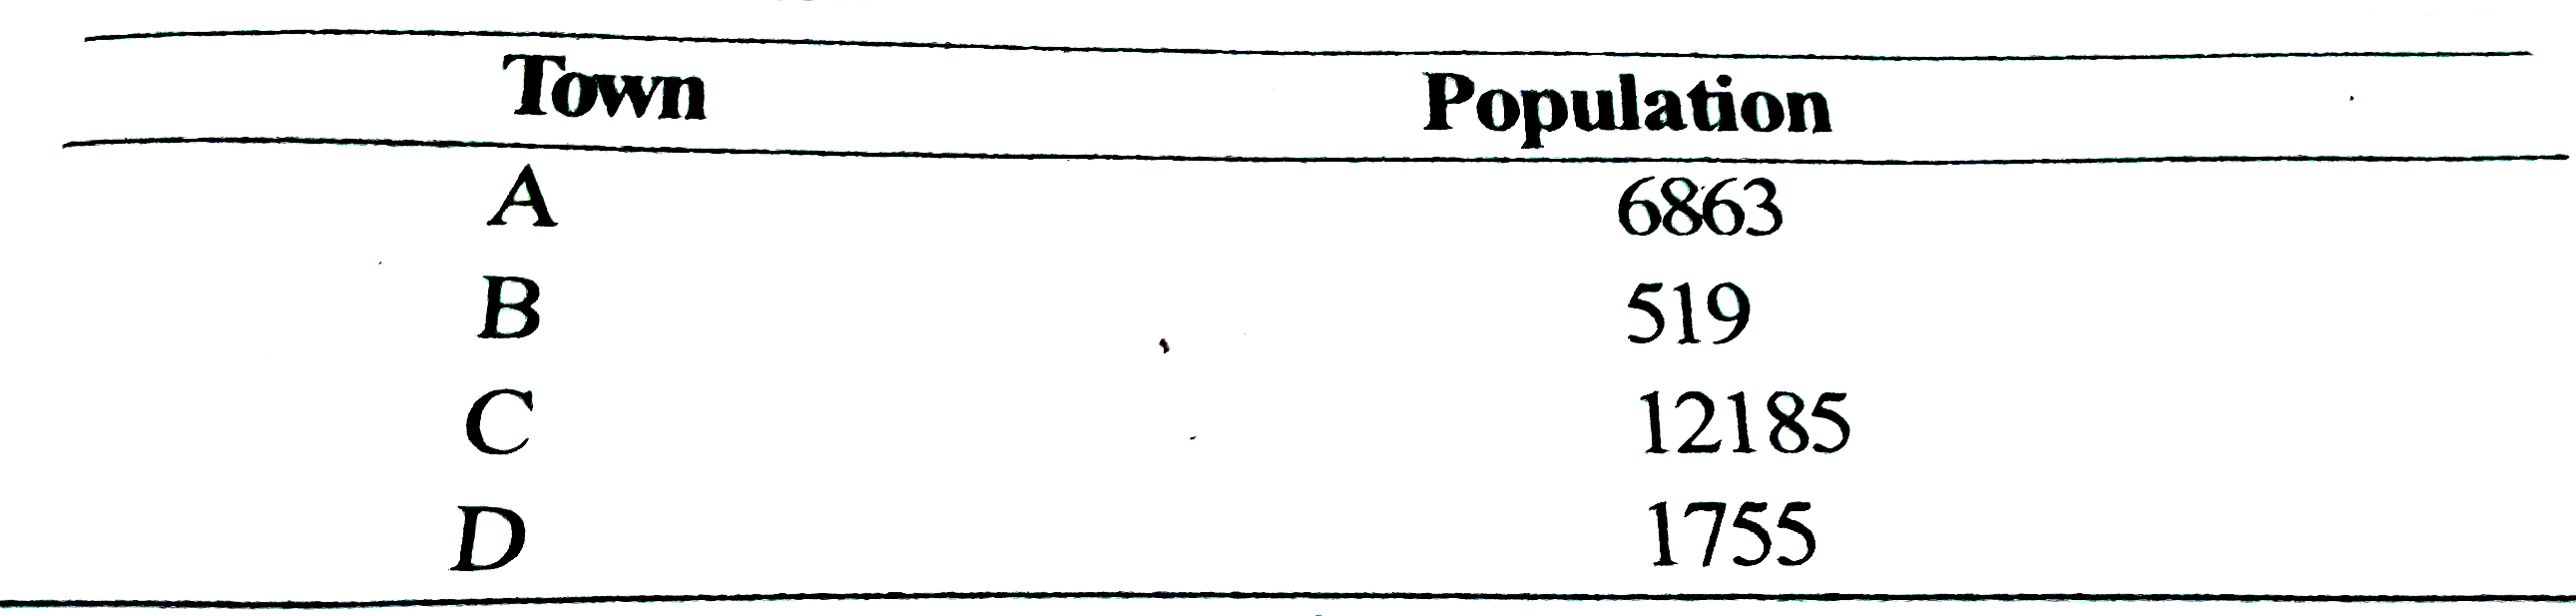
- The populations of four towns A, B, C and D as on 2001 are as follows:...
Text Solution
|
- Let m be the mid - point and l the upper class limit of a class in a c...
Text Solution
|
- When rectangles are drawn with the areas proportional to the frequenci...
Text Solution
|
- If a frequency distribution for the number of persons x in household i...
Text Solution
|
- The arithmetic mean of a set of 10 numbers is 20. If each number is fi...
Text Solution
|
- The mean of twenty observations x(1),x(2),x(3),x(4), . . . .x(20) is m...
Text Solution
|
- The relationship between mean, median and mode for a moderately skewed...
Text Solution
|
- If sum of x observations is 216 and their mean is 27. Then the number ...
Text Solution
|
- Seven of the eight numbers in a distribution are 11, 16, 6, 10, 13, 11...
Text Solution
|
- The mean of a,b and c is x. If ab+bc+ca=0 what is the mean of a^(2),b^...
Text Solution
|
- The median of a set of 11 distinct observations is 15.5. If each of th...
Text Solution
|