Text Solution
Verified by Experts


Topper's Solved these Questions
BIODIVERSITY AND CONSERVATION
BETTER CHOICE PUBLICATION|Exercise SHORT ANSWER TYPE QUESTIONS (3 MARKS)|13 VideosBIODIVERSITY AND CONSERVATION
BETTER CHOICE PUBLICATION|Exercise SHORT ANSWER TYPE QUESTIONS (MOST EXPECTED QUESTIONS 3 MARKS)|16 VideosBIODIVERSITY AND CONSERVATION
BETTER CHOICE PUBLICATION|Exercise SHORT ANSWER TYPE QUESTIONS ( 2 MARKS)|12 VideosBIOTECHNOLOGY AND ITS APPLICATIONS
BETTER CHOICE PUBLICATION|Exercise LONG ANSWER TYPE QUESTIONS|18 Videos
Similar Questions
Explore conceptually related problems
BETTER CHOICE PUBLICATION-BIODIVERSITY AND CONSERVATION-SHORT ANSWER TYPE QUESTIONS (MOST EXPECTED QUESTIONS 2 MARKS)
- Justify with the help of an example where a deliberate attempt by huma...
Text Solution
|
- Explain 'rivet popper hypothesis'.
Text Solution
|
- How is biodiversity impoirtant for ecosystem functioning?
Text Solution
|
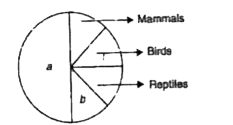
- Name the unlabelled areas 'a' and 'b' of the pie chart representing bi...
Text Solution
|
- A particular species of wild cat is endangered.In order to save them f...
Text Solution
|
- The relation between species richness and area for a wide variety of t...
Text Solution
|
- What is extinction and give different types of extinction of species?
Text Solution
|
- Drescribe international Efforts for conservation of biodiversity.
Text Solution
|