Text Solution
Verified by Experts


Topper's Solved these Questions
BIODIVERSITY AND CONSERVATION
BETTER CHOICE PUBLICATION|Exercise LONG ANSWER TYPE QUESTIONS (5 MARKS)|13 VideosBIODIVERSITY AND CONSERVATION
BETTER CHOICE PUBLICATION|Exercise LONG ANSWER TYPE QUESTIONS (MOST EXPECTED QUESTIONS 5 MARKS)|9 VideosBIODIVERSITY AND CONSERVATION
BETTER CHOICE PUBLICATION|Exercise SHORT ANSWER TYPE QUESTIONS (3 MARKS)|13 VideosBIOTECHNOLOGY AND ITS APPLICATIONS
BETTER CHOICE PUBLICATION|Exercise LONG ANSWER TYPE QUESTIONS|18 Videos
Similar Questions
Explore conceptually related problems
BETTER CHOICE PUBLICATION-BIODIVERSITY AND CONSERVATION-SHORT ANSWER TYPE QUESTIONS (MOST EXPECTED QUESTIONS 3 MARKS)
- What is the significance of the slope of regression in a species - are...
Text Solution
|
- What are major causes of species losses in a geographical area ?
Text Solution
|
- What are the main benefits of protected areas.
Text Solution
|
- What are the sacred forests and sacred lakes?
Text Solution
|
- List three consequences of loss of biodiversity.
Text Solution
|
- Among the ecosystem services are control of floods and soil erosion. H...
Text Solution
|
- What is the significance of the slope of regression in a species - are...
Text Solution
|
- What are sacred groves ? What is their role in conservation?
Text Solution
|
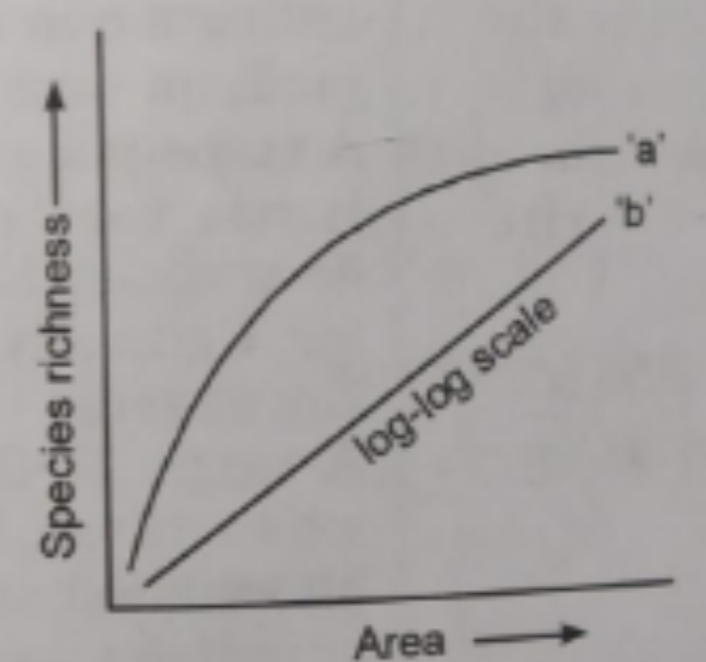
- The following graph shows the species area relationship. Answer the fo...
Text Solution
|
- The following graph shows the species area relationship.Answer the fol...
Text Solution
|
- The following graph shows the species area relationship. Answer the fo...
Text Solution
|
- The following graph shows the species area relationship. Answer the fo...
Text Solution
|
- Alien species are highly invasive and threat to indigenous species.Sub...
Text Solution
|
- Giving two reasons explain why there is more species biodiversity in t...
Text Solution
|
- Give three hierarchial levels of biodiversity.
Text Solution
|
- The tropics between 23.5^(@) N to 23.5^(@)S harbours more species than...
Text Solution
|