


ALLEN-RACE-RACE 19
- Which of the following pairs of graphs does not represent the motion o...
Text Solution
|
- The velocity time graph of a particle moving in a straight line is giv...
Text Solution
|
- Figure shows acceleration versus time graph of a particle starting fro...
Text Solution
|
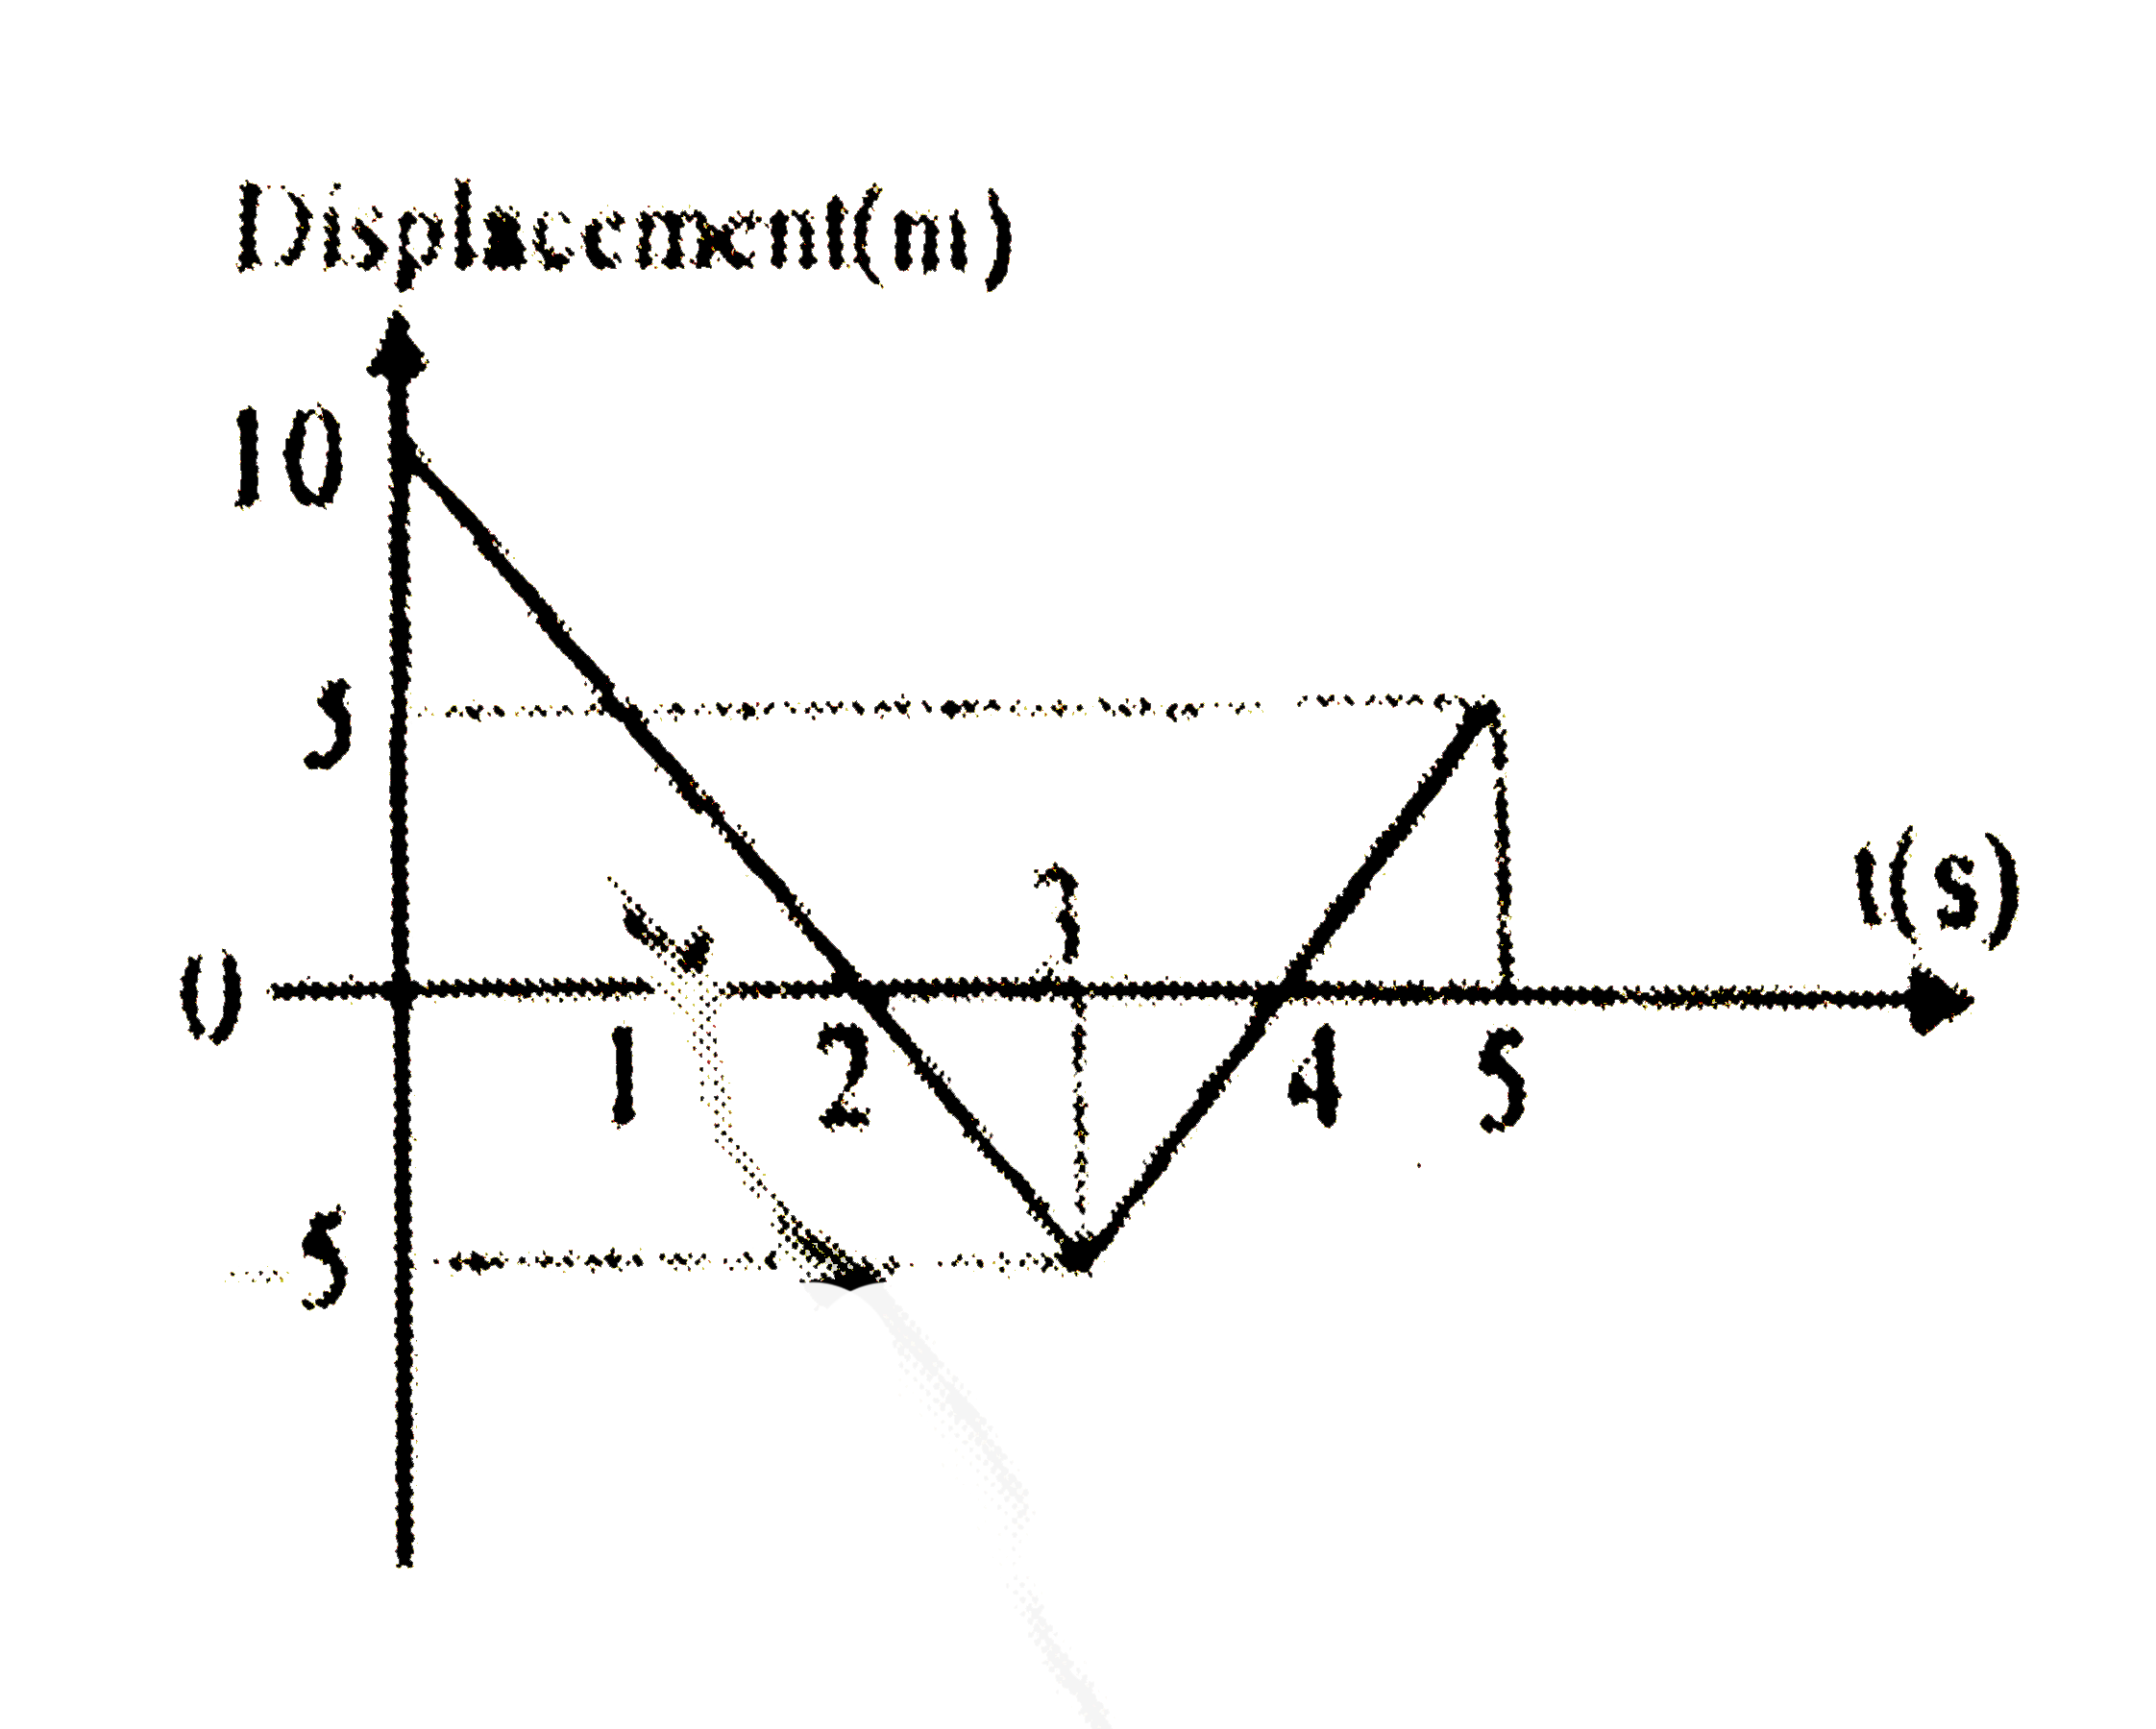
- The diagram shows the displacement - time graph for a particle moving ...
Text Solution
|
- If a, b, c, are positive real numbers and log(4) a=log(6)b=log(9) (a+b...
Text Solution
|
- Lat x=2^((log(2)3) (log(3) 4)....), where the last term in exponent is...
Text Solution
|
- A point 'P' is an arbitrary interior point of an equilateral triangle ...
Text Solution
|
- The value of the expression log(10) (tan 6^(@))+log(10) (tan 12^(@))+l...
Text Solution
|
- Satement-1 : If secx + cos x =2 then (sec x)^(n)+(cos x^(n)=2. becau...
Text Solution
|
- f(x)=(1/sqrt(b-a))(((sqrt((b-a)/a))sin2x)/sqrt(1+((sqrt(b-a)/a))sinx)^...
Text Solution
|
- Let y=(2^(log(2^(1//4))x)-3^(log(27) (x^(2)+1)^(3))-2x)/(7^(4 log(4 9)...
Text Solution
|
- 3 statements are given below each of which is either True of false. In...
Text Solution
|
- If 0 lt x lt pi/4 and cos x+sin x=5/4, find the numerical value of (4(...
Text Solution
|
- If the ordered pairs (x(1), y(1)) and (x(2), y(2)) satisfying the syst...
Text Solution
|