Text Solution
Verified by Experts


Topper's Solved these Questions
Similar Questions
Explore conceptually related problems
ALLEN-NEWTON'S LAWS OF MOTION & FRICTION-EXERCISE (JA)
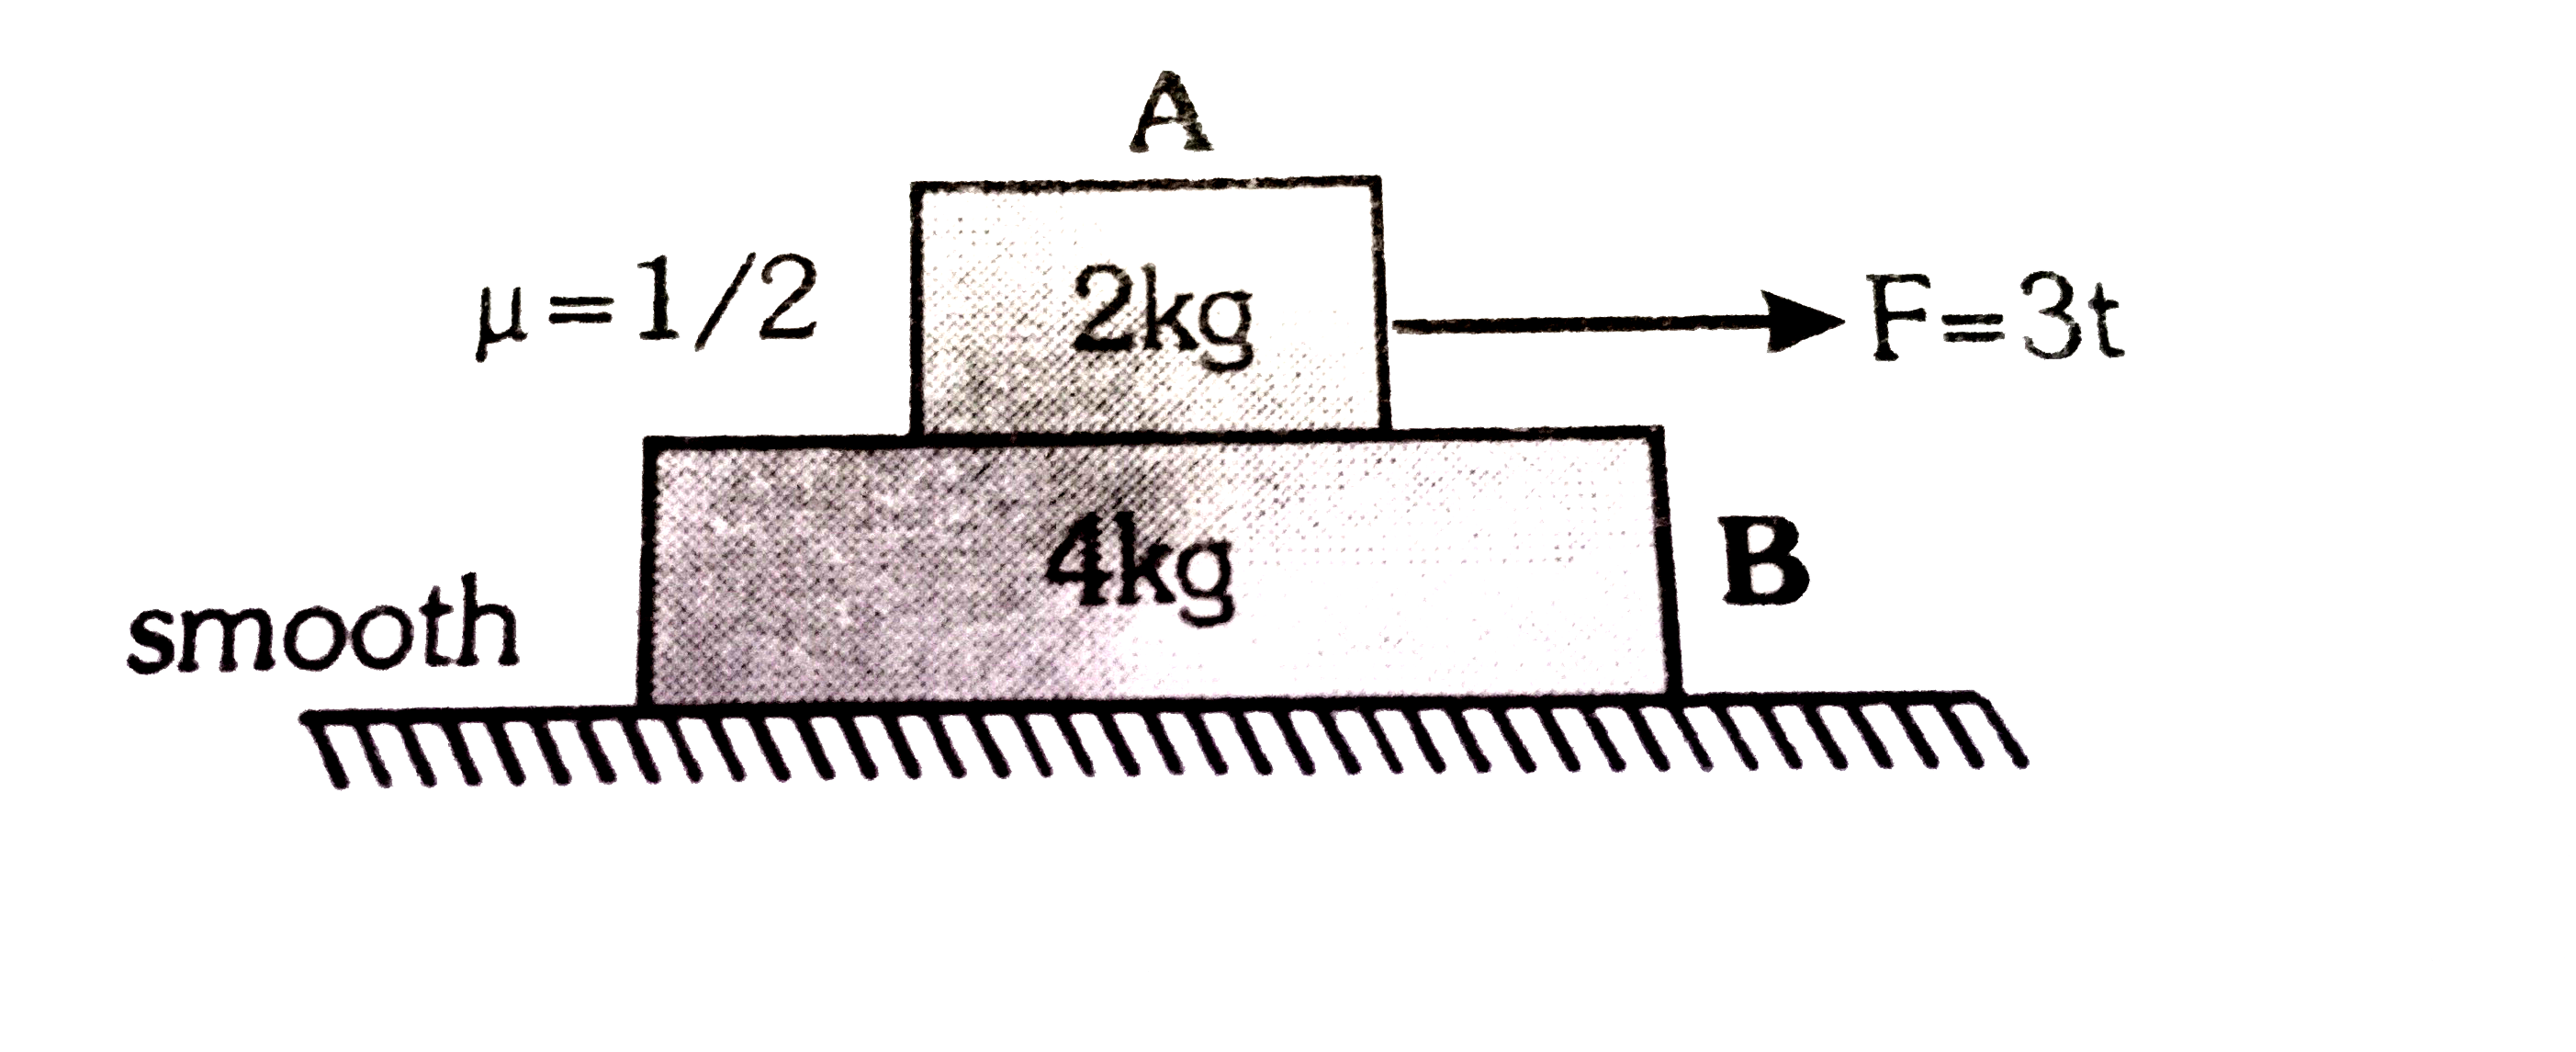
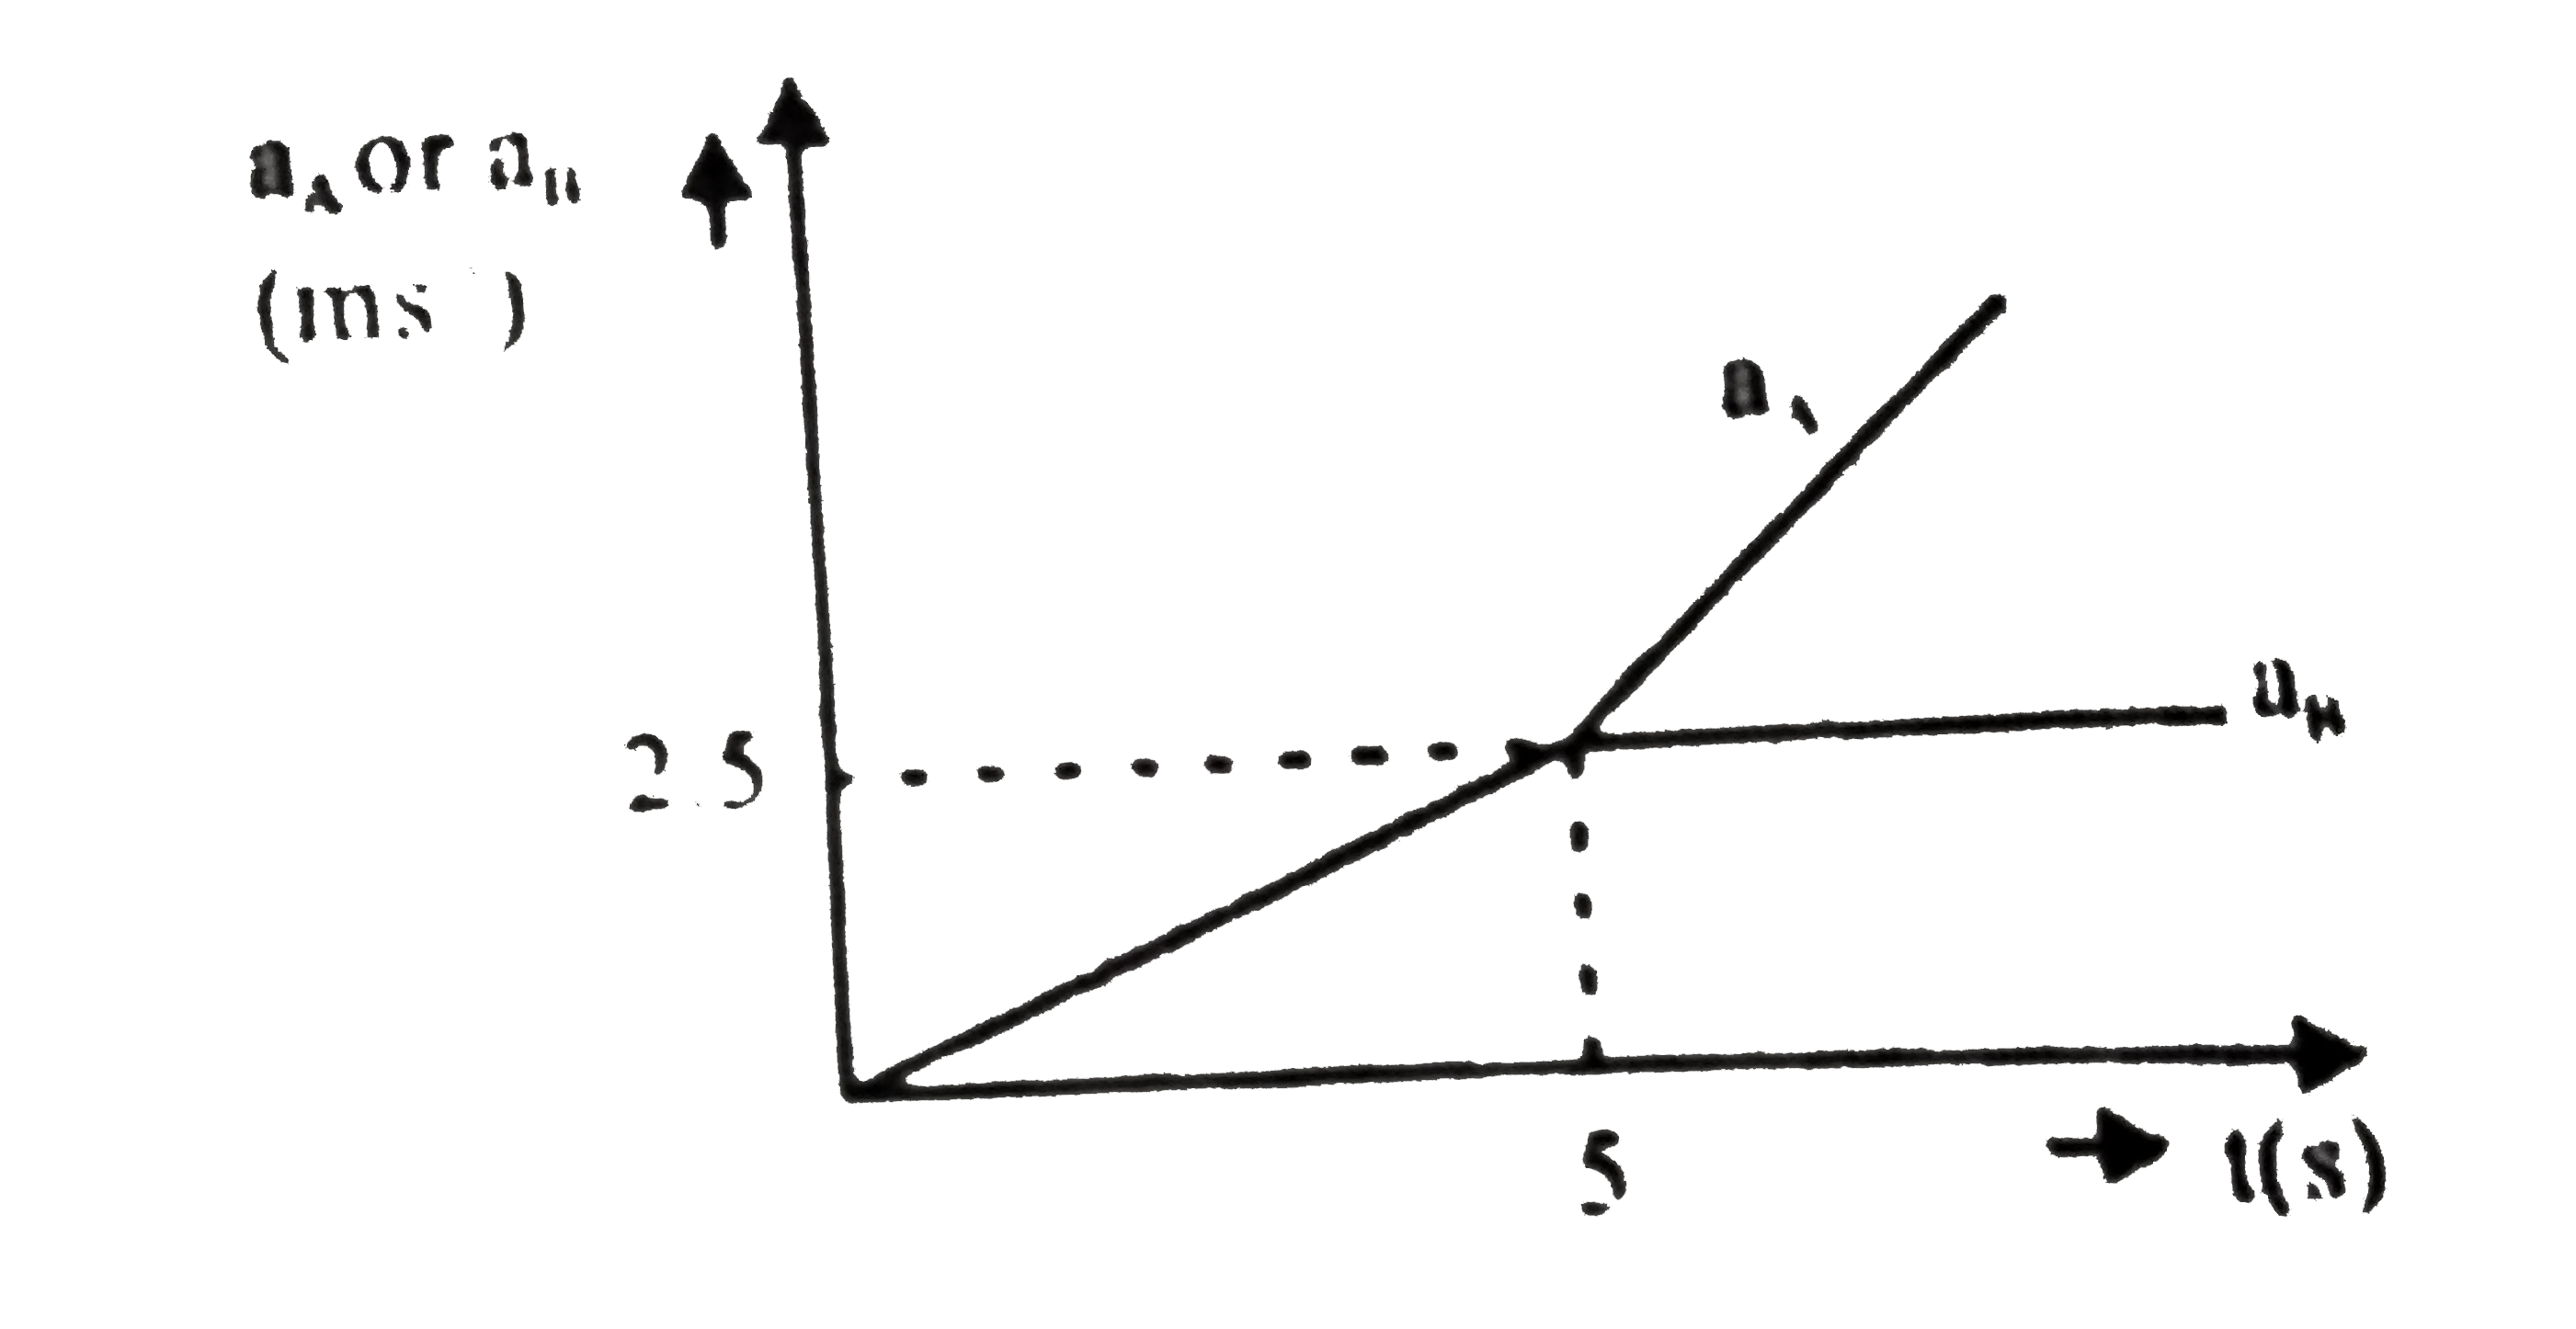
- For shown situation draw a graph showing acceleration of A and B on y-...
Text Solution
|
- A piece of wire is bent in the shape of a parabola y=kx^(2) (y-axis ve...
Text Solution
|
- A block of mass m is on an inclined L plane of angle 0. The coefficien...
Text Solution
|
- A block is moving on an inclined plane making an angle 45^(@) with the...
Text Solution
|
- A Block of mass m(1) = 1 kg and another mass m(2) = 2kg are placed t...
Text Solution
|