Home
Class 12
BIOLOGY
The figure is showing relative constibut...

The figure is showing relative constibution of various green house gases to total global warming.

In above diagram find out correct gaseous contributio:-

A

`N_(2)O`

B

`CFC_(s)`

C

Methane

D

Carbon dioxide.

Text Solution

Verified by Experts

Promotional Banner

Topper's Solved these Questions

  • ORGANISM & ENVIRONMENT AND DEMOGRAPHY

    ALLEN|Exercise EXERCISE-III|110 Videos
  • ORGANISM & ENVIRONMENT AND DEMOGRAPHY

    ALLEN|Exercise Assertion and Reason|26 Videos
  • ORGANISM & ENVIRONMENT AND DEMOGRAPHY

    ALLEN|Exercise EXERCISE-I|127 Videos
  • NEURAL CONTROL AND COORDINATION

    ALLEN|Exercise Questions|61 Videos
  • ORGANISM AND POPULATION (ECOLOGY)

    ALLEN|Exercise S|26 Videos

Similar Questions

Explore conceptually related problems

Relative contribution of various green house gases to total global warming is given in the diagrams. Identify the green house gases

Given pie-diagram represents the relative contribution of various greenhouse gases to total global warming. Identify the gases P, Q, R and S.

Select the mismatched pairs w.r.t. relative contribution of various green house gases to totral global warming: (a) CFCs - 20% (b) N_2O -6% © Carbon dioxide - 60% (d) Methane - 14%

Name the Green House gas that contribute to total global warming.

What are green house gases. How are they responsible for global warming ?

Given pie-diagram represents the relative contribution of various GHGs to total global warming. Select the correct statements(s) regarding A, B and C.

'Indiscriminate human activities have strengthened the greenhouse effect resulting in Global Warming''. Give the relative contribution of various Green House Gases in the form of a pie chart and explain the fate of the energy of sunlight reaching the earth’s surface contributing towards Global Warming.

Select the correct option for A, B , C and D given in the figure with respect to the relative contribution of various greenhouse gases to global warming.

Study the given figure which shows the development of root nodules in soyabean. Match the correct explanation and find the correct sequence for labelled diagrams. (I) Rhizobium bacteria contacting a susceptible root hair. (II) A mature nodule having vascular connection with roots. (III). Infection thread carrying bacteria to the inner cortex. (IV). Curling of root hair due to successful infection.

Which of the following is the correct percentage of the two (out of the total of 4) greenhouse gases that contibute to the total global warming?

ALLEN-ORGANISM & ENVIRONMENT AND DEMOGRAPHY-EXERCISE-II
  1. Which one of the following is an example of mutualism ?

    Text Solution

    |

  2. Which of the following is true:-

    Text Solution

    |

  3. Cryopreservation of gametes of threatened species in viable and fertil...

    Text Solution

    |

  4. High value of BOD (Biochemical Oxygen Demand) indicates that

    Text Solution

    |

  5. The UN Conference of Parties on climate change in the year 2011 was he...

    Text Solution

    |

  6. Rachel Carson's famous book "Silent Spring" is related to

    Text Solution

    |

  7. Most animals are tree dwellers in a

    Text Solution

    |

  8. In which of the following both pairs have correct combination?

    Text Solution

    |

  9. Vertical distribution of different species occupying different levels ...

    Text Solution

    |

  10. The mass of living material at a trophic level at a particular time is...

    Text Solution

    |

  11. In an ecosystem the rate of production of or- ganic matter during phot...

    Text Solution

    |

  12. Secondary Succession takes place on/ in

    Text Solution

    |

  13. The following graph depicts changes in two populations (A and B) of he...

    Text Solution

    |

  14. Most animals that live in deep oceanic wa- ters are

    Text Solution

    |

  15. An association of individuals of different species living in the same ...

    Text Solution

    |

  16. Eutrophication of water bodies leading to killing to fishes is mainly...

    Text Solution

    |

  17. Acid rain is caused by increase in the atmo- ,spheric concentration of

    Text Solution

    |

  18. Increase in concentration of the toxicant at successive trophic levels...

    Text Solution

    |

  19. Which of the following is not a cause for loss of biodiversity

    Text Solution

    |

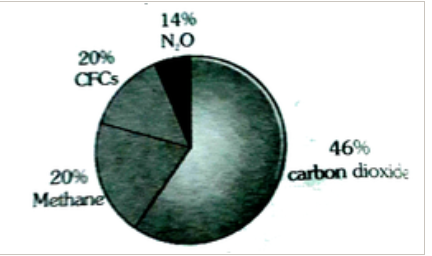
  20. The figure is showing relative constibution of various green house gas...

    Text Solution

    |