


Topper's Solved these Questions
Similar Questions
Explore conceptually related problems
SWAN PUBLICATION-DATA HANDLING-Exercise 5.3
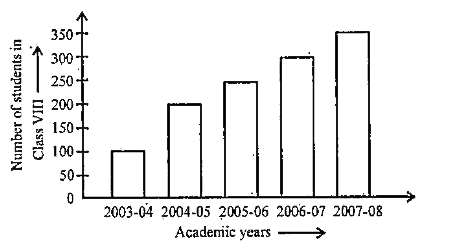
- A bar graph : A display of information using bars of uniform width, th...
Text Solution
|
- List the outcomes you can see in these experiments: Spinning a wheel
Text Solution
|
- List the outcomes you can see in these experiments. Tossing two c...
Text Solution
|
- When a die is thrown, list the outcomes of an event of getting : (i) (...
Text Solution
|
- When a die is thrown, list the outcomes of an event of getting : (ii) ...
Text Solution
|
- Find x+y+z
Text Solution
|
- Probablity of getting an ace from a well shuffled deck of 52 playing c...
Text Solution
|
- Find the : Probability of getting a red apple. (See figure below)
Text Solution
|
- Numbers 1 to 10 are written on ten separate slips (one number on one s...
Text Solution
|
- Numbers 1 to 10 are written on ten separate slips (one number on one s...
Text Solution
|
- Numbers 1 to 10 are written on ten separate slips (one number on one s...
Text Solution
|
- Numbers 1 to 10 are written on ten separate slips (one number on one s...
Text Solution
|
- If you have a spinning wheel with 3 green sectors, 1 blue sector and 1...
Text Solution
|
- Find the probabilities of the events: When a die is thrown, list the o...
Text Solution
|