


Topper's Solved these Questions
DATA HANDLING
SWAN PUBLICATION|Exercise Exercise 5.1|12 VideosDATA HANDLING
SWAN PUBLICATION|Exercise Exercise 5.2|11 VideosDATA HANDLING
SWAN PUBLICATION|Exercise Think, Discuss And Write|7 VideosCUBES AND CUBE ROOTS
SWAN PUBLICATION|Exercise EXERCISE 7.2|9 VideosDIRECT AND INVERSE PROPORTIONS
SWAN PUBLICATION|Exercise Exercise 13.2|16 Videos
Similar Questions
Explore conceptually related problems
SWAN PUBLICATION-DATA HANDLING-Try These
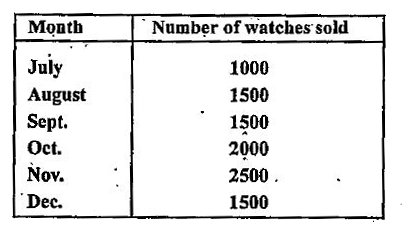
- Draw an appropriate graph to represent the given information.
Text Solution
|
- Draw an appropriate graph to represent the given information.
Text Solution
|
- Draw an appropriate graph to represent the given information. Percen...
Text Solution
|
- A group of students were asked to say which animal they would like mos...
Text Solution
|
- Study the following frequency distribution table and answer the questi...
Text Solution
|
- Study the following frequency distribution table and answer the questi...
Text Solution
|
- Study the following frequency distribution table and answer the questi...
Text Solution
|
- Study the following disttribution table and answer the questions given...
Text Solution
|
- Study the following disttribution table and answer the questions given...
Text Solution
|
- Construct a frequency distribution table for the data on weights ( in...
Text Solution
|
- The following graph represents the ages of 25 teachers of a school : ...
Text Solution
|
- The following graph represents the ages of 25 teachers of a school : ...
Text Solution
|
- Observe the histogram (Fig.) and answer the questions given below : ...
Text Solution
|
- Observe the histogram (Fig.) and answer the questions given below : ...
Text Solution
|
- Observe the histogram (Fig.) and answer the questions given below : ...
Text Solution
|
- Observe the histogram (Fig.) and answer the questions given below : ...
Text Solution
|
- Each of the following pie charts gives you a different piece of inform...
Text Solution
|
- Answer the following questions based on the pie chart given : Which ...
Text Solution
|
- Which two ttypes of programmes have number of viewers equal to those w...
Text Solution
|
- Draw a pie chart of the data given below : The time spent by a child...
Text Solution
|