Text Solution
Verified by Experts
The correct Answer is:


Topper's Solved these Questions
INTRODUCTION TO GRAPHS
SWAN PUBLICATION|Exercise Exercise 15.2|8 VideosINTRODUCTION TO GRAPHS
SWAN PUBLICATION|Exercise Exercise 15.3|8 VideosINTRODUCTION TO GRAPHS
SWAN PUBLICATION|Exercise Try These|2 VideosFACTORISATION
SWAN PUBLICATION|Exercise EXERCISE 14.4|23 VideosLINEAR EQUATIONS IN ONE VARIABLE
SWAN PUBLICATION|Exercise EXERCISE 2.6|14 Videos
Similar Questions
Explore conceptually related problems
SWAN PUBLICATION-INTRODUCTION TO GRAPHS -Exercise 15.1
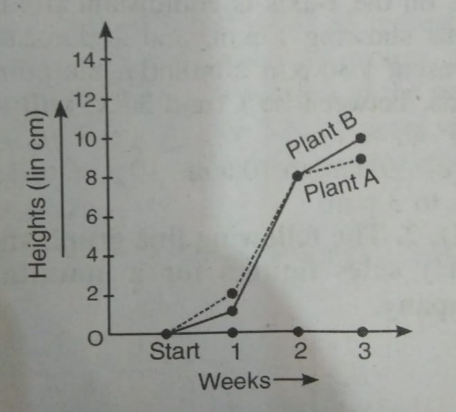
- For an experiment in Botany,two different plants, plant A nad plant B ...
Text Solution
|
- For an experiment in Botany,two different plants, plant A nad plant B ...
Text Solution
|
- For an experiment in Botany,two different plants, plant A nad plant B ...
Text Solution
|
- For an experiment in Botany,two different plants, plant A nad plant B ...
Text Solution
|
- For an experiment in Botany,two different plants, plant A nad plant B ...
Text Solution
|
- For an experiment in Botany,two different plants, plant A nad plant B ...
Text Solution
|
- For an experiment in Botany,two different plants, plant A nad plant B ...
Text Solution
|
- For an experiment in Botany, two different plants, plant A and plant B...
Text Solution
|
- For an experiment in Botany,two different plants, plant A nad plant B ...
Text Solution
|
- The following graph shows the temperature forecast and the actual temp...
Text Solution
|
- The following graph shows the temperature forecast and the actual temp...
Text Solution
|
- The following graph shows the temperature forecast and the actual temp...
Text Solution
|
- On which day did the actual temperature differ the most from ...
Text Solution
|
- Use the tables below to draw linear graphs. The number of days a hill ...
Text Solution
|
- Use the tables below to draw linear graphs. Population (in thousads ) ...
Text Solution
|
- A courier-person cycles from a town to a neighbouring burban area to d...
Text Solution
|
- A courier -person cycles from a town to a neighbouring suburban area ...
Text Solution
|
- A courier -person cycles from a town to a neighbouring suburban area ...
Text Solution
|
- A courier -person cycles from a town to a neighbouring subrban area t...
Text Solution
|
- A courier -person cycles from a town to a neighbouring subrban area t...
Text Solution
|