Text Solution
Verified by Experts


Topper's Solved these Questions
IMPROVEMENT IN FOOD RESOURCES
MTG IIT JEE FOUNDATION|Exercise Olympaid/HOTS Corner |10 VideosIMPROVEMENT IN FOOD RESOURCES
MTG IIT JEE FOUNDATION|Exercise Exercise (Subjective Questions) (Short Answer Type)|19 VideosFOOTSTEPS TOWARDS NEET
MTG IIT JEE FOUNDATION|Exercise MULTIPLE CHOICE QUESTIONS |90 VideosNATURAL RESOURCES
MTG IIT JEE FOUNDATION|Exercise Olympiad/HOTS Corner|11 Videos
Similar Questions
Explore conceptually related problems
MTG IIT JEE FOUNDATION-IMPROVEMENT IN FOOD RESOURCES-Exercise (Subjective Questions) (Long Answer Type)
- What are the various factors for which varietal improvement is done? E...
Text Solution
|
- Cultivation practices and crop yield are related to environmental cond...
Text Solution
|
- What is pasturage and how is it related to honey production?
Text Solution
|
- State four desirable characteristics of bee varieties suitable for hon...
Text Solution
|
- Why do farmers use bee-keeping as an additional income generating acti...
Text Solution
|
- What are the various methods of irrigation in India?
Text Solution
|
- Large amount of food grains get spoiled every year in India due to imp...
Text Solution
|
- What forms the basis for classifying manures? Describe any two types o...
Text Solution
|
- Explain the different cropping patterns.
Text Solution
|
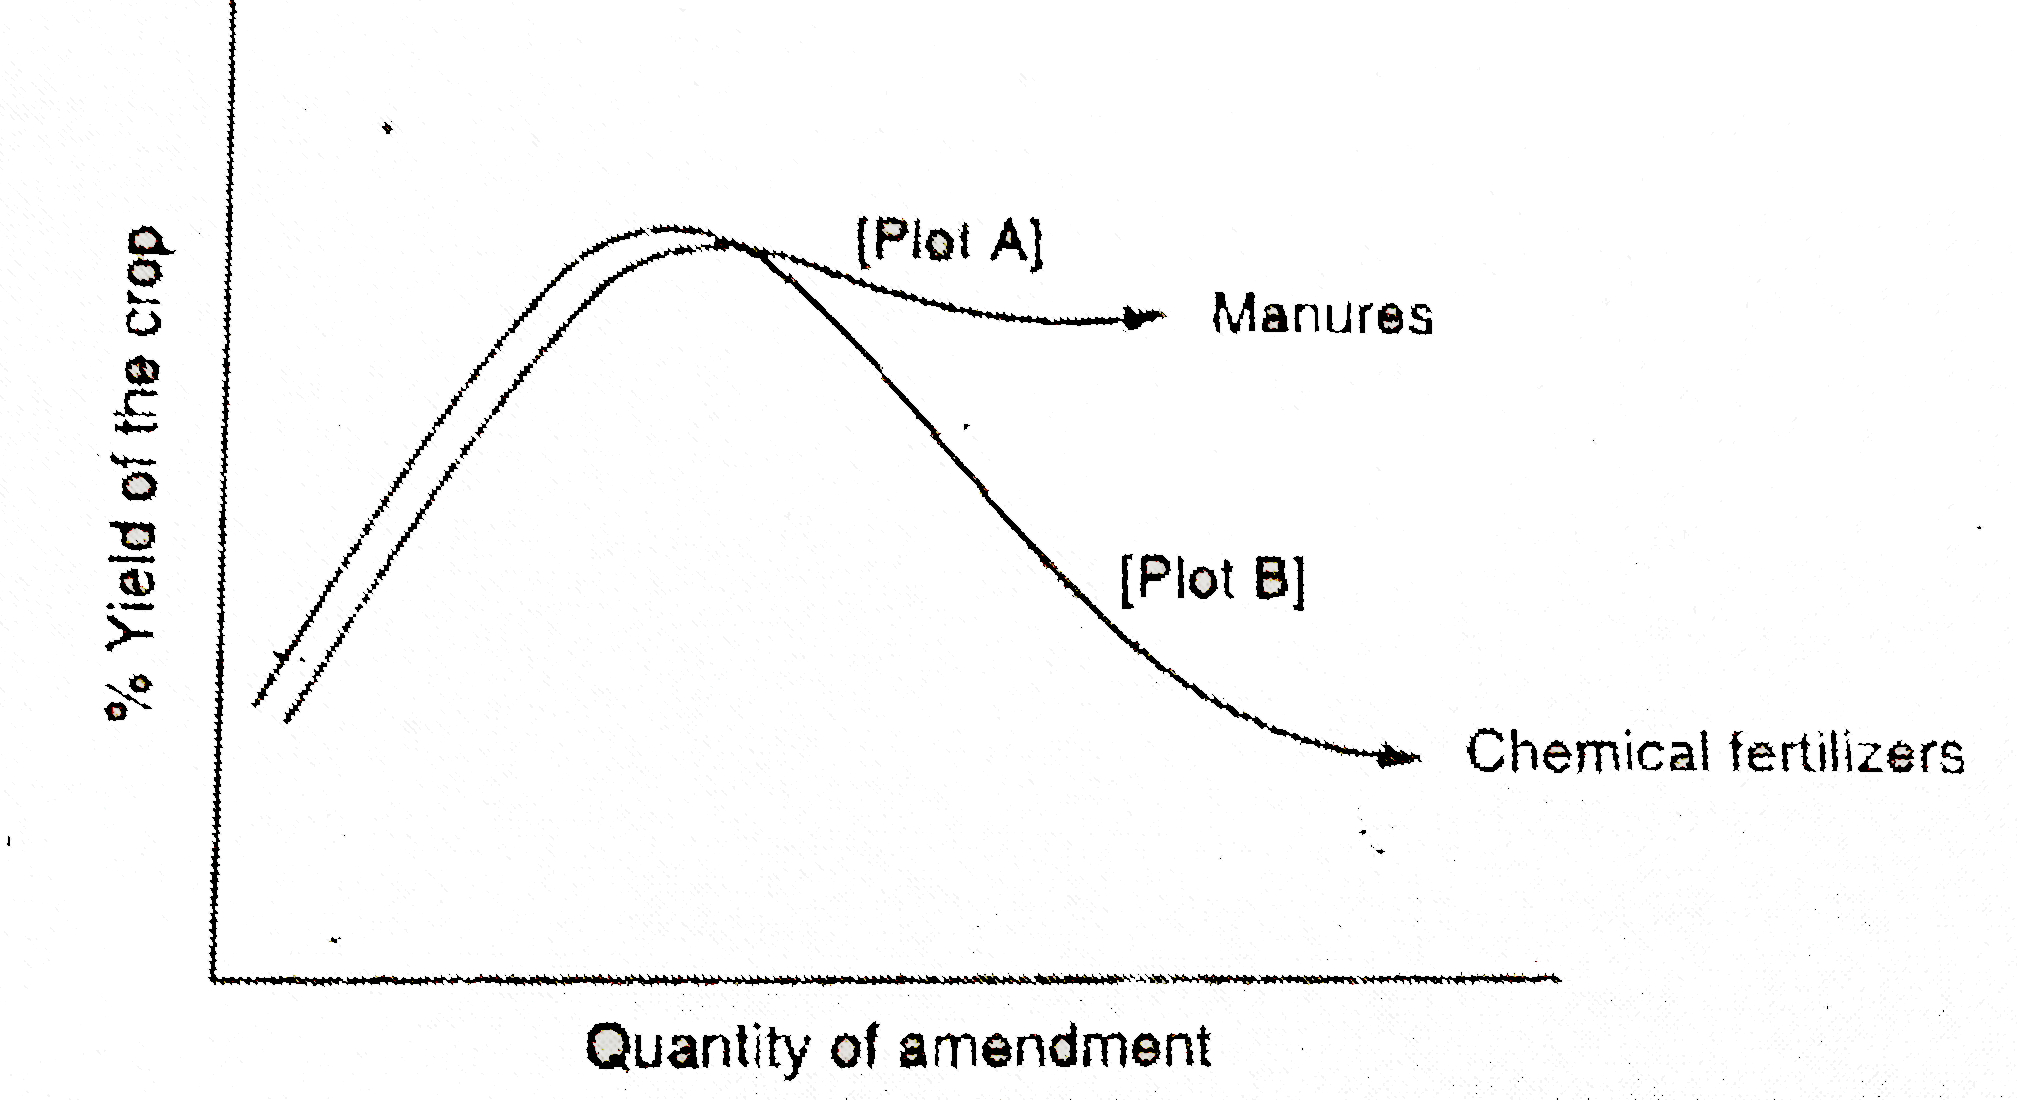
- The figure shows two crop fields (plots A and B) have been treated by ...
Text Solution
|
- The figure shows two crop fields (plots A and B) have been treated by ...
Text Solution
|
- The figure shows two crop fields (plots A and B) have been treated by ...
Text Solution
|